🏦CME LOWERS SILVER MARGINS TO 8%⚠️⚡️The CME lowered margin rates on Silver, Platinum, & Palladium Futures at the Close Thursday:Shanghai returns & suddely the CME feels the need to entice traders back into metals DERIVATIVES. X post by SilverTrade @silvertrade.
▲ 3 r/OccupySilver+1 crossposts

🏦CME LOWERS SILVER MARGINS TO 8%⚠️⚡️The CME lowered margin rates on Silver, Platinum, & Palladium Futures at the Close Thursday:Shanghai returns & suddely the CME feels the need to entice traders back into metals DERIVATIVES. X post by SilverTrade @silvertrade.

Remove space behind “h” to link to source:

h ttps://x.com/silvertrade/status/2108300051264999857?s=20

u/Mothersilverape — 6 days ago
▲ 2 r/OccupySilver+1 crossposts

Silver $58.96, demand is stacking. Mine supply is not.Three buyers. One metal. Mines are not keeping up.• Solar: still the biggest single use. World Silver Survey 2026—197.6 Moz in 2024, 186.6 Moz in 2025, about 151 Moz forecast for 2026. X Post By StockShaman ⚒ #PeakCopper AKA Greg Shafransky 🍌

Installations keep rising; silver per cell is being cut because the metal got expensive. Even after that cut, solar alone is larger than most countries' mines.

• AI server farms: same survey says data center off-take alone is on track for more than 10% of all electrical and electronics silver demand in 2026—over 42 million ounces. About Chile’s annual mine output, for one application. Connectors, chip packaging, conductive pastes, thermal interfaces, switchgear contacts.

• Solid-state batteries: Samsung’s silver-carbon anode design is estimated at 1 kg (~32 oz) per 100 kWh pack, versus 25–50 grams in a normal EV. Mass production is targeted around 2027. A 10% adoption case is roughly 55 million ounces a year—new demand, not a rounding error.

• Supply: Global mine output has been stuck around 820–850 million ounces. The market has already logged multi-year deficits (about 40 Moz in 2025, with about 46 Moz forecast for 2026).

Three buyers. One metal. Mines are not keeping up.

Remove space behind “h “ to link to source:

h ttps://x.com/StockShaman/status/2108210638724161802?s=20

u/Mothersilverape — 6 days ago

October is the only month that has been green (positive) for Silver every year since 2021! Will 2026 break the streak - or keep it alive? X post by Bald Guy Money@baldguymoney·4h

Remove space behind “h” to link to source:

h ttps://x.com/baldguymoney/status/2106880789992607944?s=20

u/Mothersilverape — 10 days ago

The only silver chart that really matters🧘‍♂️🥈. X post by Dr. Potassium@potassium_phd.

Remove space behind “h” to link to source:

h ttps://x.com/potassium_phd/status/2106826958466359551?s=20

u/Mothersilverape — 10 days ago

The world’s most valuable assets.Gold: #1. Silver: #6. That gap is worth watching #gold #silver. X post by TraditionalMoney@tradition_money.

Remove space behind “h” to link to source:

h ttps://x.com/tradition_money/status/2106710254075486335?s=20

This is a silver lining for those who save wealth in solid silver. (Not paper silver.)

u/Mothersilverape — 11 days ago
▲ 3 r/OccupySilver+1 crossposts

Silver’s been Money since the beginning and will stand the test of time! X post by SilverCrusader @RichardCabezza.

Remove space after “h” to link to source:

h ttps://x.com/RichardCabezza/status/2105440611444683127?s=20

u/Mothersilverape — 14 days ago
▲ 3 r/OccupySilver+1 crossposts

What is the best conductor of electricity on Earth? SILVER Silver is used in: 1 Solar farm = 30,000 oz. 1 Nuclear power plant = 60,000 oz of silver. 1 Missile = 500 oz. X post by Casey Donaldson.

With new EV battery technology coming out, we are looking at 55 million oz of silver per year with a 10% adoption rate.

In the new age of electrification, silver demand will explode.

You need to own more Silver.

Remove space behind “h” to link to source:

h ttps://x.com/caseyjdonaldson/status/2105381163879547186?s=20

u/Mothersilverape — 14 days ago

Silver is cheap.49% below its nominal ATH ($120). 72% below its CPI-adjusted ATH ($217). 92% below its M2 inflation-adjusted ATH ($774). X post by GoldSilver HQ @GoldSilverHQ

Remove space behind “h” to link to source:

h ttps://x.com/GoldSilverHQ/status/2105075399453745652?s=20

u/Mothersilverape — 15 days ago

In 2002, it took 40,871 oz of silver to buy the median priced new U.S. home. 2026 H1: 5,201 oz.Since 2002, silver has gained nearly 8x in purchasing power against U.S. housing. #silver. X post by TraditionalMoney @tradition_money.

Remove space behind “h” to link to source:

h ttps://x.com/tradition_money/status/2105209376214515805?s=20

u/Mothersilverape — 15 days ago

The World Is Entering a New Era of Energy Security. By Shahriar Sheikhlar - The wars in Ukraine and the Middle East are exposing how energy security is inseparable from financial, military, transportation and geopolitical security.

  • Europe, China and the Gulf face different forms of strategic dependence, from imported LNG and maritime chokepoints to foreign military technology and global financial systems.
  • The emerging energy order is shifting from maximum efficiency toward resilience, prioritizing multiple suppliers, alternative routes, strategic reserves and greater domestic capacity over reliance on the cheapest source.

The U.S.–Iran and Russia–Ukraine wars are more than regional or military conflicts. They are exposing weaknesses in the global energy and economic system and demonstrating that energy security can no longer be seen as independent of financial security, transportation, military security, strategic autonomy, and even ties with world power hegemonies.

The Russia–Ukraine war disrupted Europe's long-standing dependence on Russian pipeline gas. The U.S.–Iran conflict has exposed another vulnerability: the concentration of global oil and LNG flows around strategic maritime routes, particularly the Strait of Hormuz, and more recently, the Bab-el-Mandeb Strait. The International Energy Agency (IEA) described the disruption by the US-Iran war through the Strait of Hormuz as the largest oil-supply disruption in its history, with roughly 20 million barrels per day of crude oil and refined products affected when the Strait was effectively closed.

Taken together, these crises may mark the beginning of a new phase of globalization—one in which countries become less willing to rely too heavily on any single source, route, technology, or global power. Complete economic or energy independence is neither realistic nor necessarily desirable. Instead, countries are likely to pursue greater strategic autonomy by diversifying their energy supplies, building alternative transport and supply routes, strengthening domestic capabilities, creating greater economic and technological resilience, and reassessing their strategic relationships with major global powers.

The evolution of today's vulnerabilities can be viewed through several stages.

The 1990s were marked by financial integration. East Asian economies became deeply integrated into international capital markets and accumulated substantial foreign-currency and dollar-linked liabilities. The 1997 Asian financial crisis demonstrated how rapidly capital-market disruptions could spread across otherwise strong economies. IMF-supported programs in Indonesia, South Korea, and Thailand illustrated the extent to which financial dependence could become a matter of national economic security. Related: U.S. Strategic Petroleum Reserve Falls to Lowest Level Since 1982

The 2000s and early 2010s exposed Europe's energy dependence. The 2007–10 financial crisis itself did not create Europe's dependence on Russian gas. Instead, it temporarily reduced European gas demand while underlying structural conditions remained: declining domestic production and continued reliance on imported pipeline gas. From 2010 onward, Russian gas became increasingly important again, supported by infrastructure such as Nord Stream and the economic attractiveness of geographically close pipeline supplies.

By 2018–21, Russian gas accounted for more than 40% of EU gas demand. After Russia's 2022 invasion of Ukraine, the loss of large volumes of Russian pipeline gas contributed to Europe's energy crisis and demonstrated the risks of concentrated external supply.

The 2010s brought a new dimension: U.S. energy power. The shale revolution transformed the United States from a major energy importer into the world's leading oil and gas producer and a major LNG exporter. Energy production therefore became increasingly connected to geopolitical and financial influence.

The 2020s have revealed a broader vulnerability: highly interconnected global supply chains. Even when countries diversify their energy suppliers, they remain exposed to shipping routes, insurance, financial markets, technology, and geopolitical shocks.

Europe: From Russian Gas to Global LNG Dependence

Europe has substantially reduced its dependence on Russian pipeline gas, but this has not created complete energy independence.

U.S. LNG has become increasingly important. The U.S. share of EU LNG imports rose from approximately 29% in 2021 to 53% in 2025. In 2025, the United States and Norway each accounted for roughly one-third of EU gas imports. Qatar, North Africa, and other suppliers also remain important.

This represents diversification, but LNG is part of a global market. Europe's physical dependence on Russian pipelines has therefore been replaced by a more diversified system that is increasingly connected to global LNG suppliers, shipping capacity, and international prices. The United States is particularly important: it supplied about 26% of global LNG exports in 2025, with the IEA expecting its share potentially to approach one-third by the end of the decade.

The lesson is not that Europe simply exchanged one dependency for another. Rather, Europe moved from a concentrated pipeline dependency toward a broader and more flexible—but still externally dependent—energy system.

The 2026 Middle East conflict adds another layer. Energy-price pressures can affect European inflation, industrial production, transport, and household purchasing power. IMF analysis has also warned that prolonged interruptions to Russian gas supplies could cause severe shortages and significant economic losses in vulnerable Central and Eastern European economies.

Europe's challenge is therefore to build strategic energy autonomy without abandoning international markets. That requires multiple suppliers, adequate storage, alternative infrastructure, domestic renewable and nuclear capacity where appropriate, and resilience against maritime and geopolitical disruptions.

China: Less U.S. Energy Dependence, but Greater Exposure to Global Chokepoints

China's situation is different from Europe's. Its vulnerability is not primarily direct dependence on U.S. oil and gas. U.S. LNG exports to China fell to zero in 2025 from approximately 0.6 Bcf/d in 2024, while China's LNG imports also declined as domestic production and Russian pipeline gas increased. China has simultaneously expanded alternative energy relationships with Russia and Central Asia, increased domestic production, developed strategic reserves, expanded renewables, and accelerated transport electrification.

However, China remains highly exposed to Middle Eastern energy flows and maritime chokepoints that are mostly affected by US policies and current US-Iran conflicts.

According to the U.S. Energy Information Administration, about 89% of crude oil and condensate passing through the Strait of Hormuz in the first half of 2025 was destined for Asian markets, with China, India, Japan, and South Korea accounting for about 74%. A large share of global LNG trade also passes through the Strait, with almost 90% of LNG exports through Hormuz in 2025 destined for Asia.

China therefore faces a paradox: reducing direct dependence on U.S. energy does not eliminate vulnerability to the global energy system. Oil and LNG prices, maritime security, financial markets, insurance, and geopolitical tensions remain interconnected.

The U.S.–Iran conflict strengthens the economic rationale for China's diversification efforts. The strategic objective is not necessarily isolation from global markets, but reducing exposure to any single supplier, route, financial system, or geopolitical pressure point.

The Middle East: Energy Wealth Without Complete Strategic Autonomy

The Middle East presents another contradiction. Persian Gulf states possess some of the world's largest oil and gas resources, yet energy wealth does not automatically create strategic independence.

Military and security relationships remain significant. SIPRI reported that 54% of major arms imported by Middle Eastern states during 2021–25 came from the United States. U.S. systems represented approximately 77% of Saudi Arabia's, 48% of Qatar's, 62% of Kuwait's, and 42% of the UAE's major arms imports.

This creates a structural paradox: Gulf countries supply critical energy to the global economy while depending heavily on external security and military technologies.

The US-Iran conflict demonstrates why reserves alone cannot guarantee energy security. Oil and gas must still move through pipelines, terminals, ports, refineries, LNG facilities, and maritime routes. Each is vulnerable to disruption.

For Middle Eastern exporters, strategic resilience therefore requires more than producing hydrocarbons; they should choose between continuing with the US, developing with China, relying on Russia, or selecting other options. It includes alternative export routes, strategic storage, domestic refining and petrochemicals, local engineering and technology capabilities, diversified security relationships, sovereign financial reserves, and broader economic diversification.

When Energy Shocks Become Corporate Shocks

Energy crises do not remain within the energy sector. Higher oil and gas prices raise costs for aviation, shipping, manufacturing, chemicals, fertilizers, agriculture, tourism, and household consumption.

To read the rest of this article click on the link above.

oilprice.com
u/Mothersilverape — 15 days ago

It’s Official: The AI Emperor Has No Clothes. Now who is going to be the first to stand up and say it? By QUOTH THE RAVEN.

With the disclosure of Anthropic’s financials yesterday, it continues to feel like we are rapidly approaching one of those moments in markets where everybody knows what everybody else knows, but nobody wants to be the first person to say it out loud. 

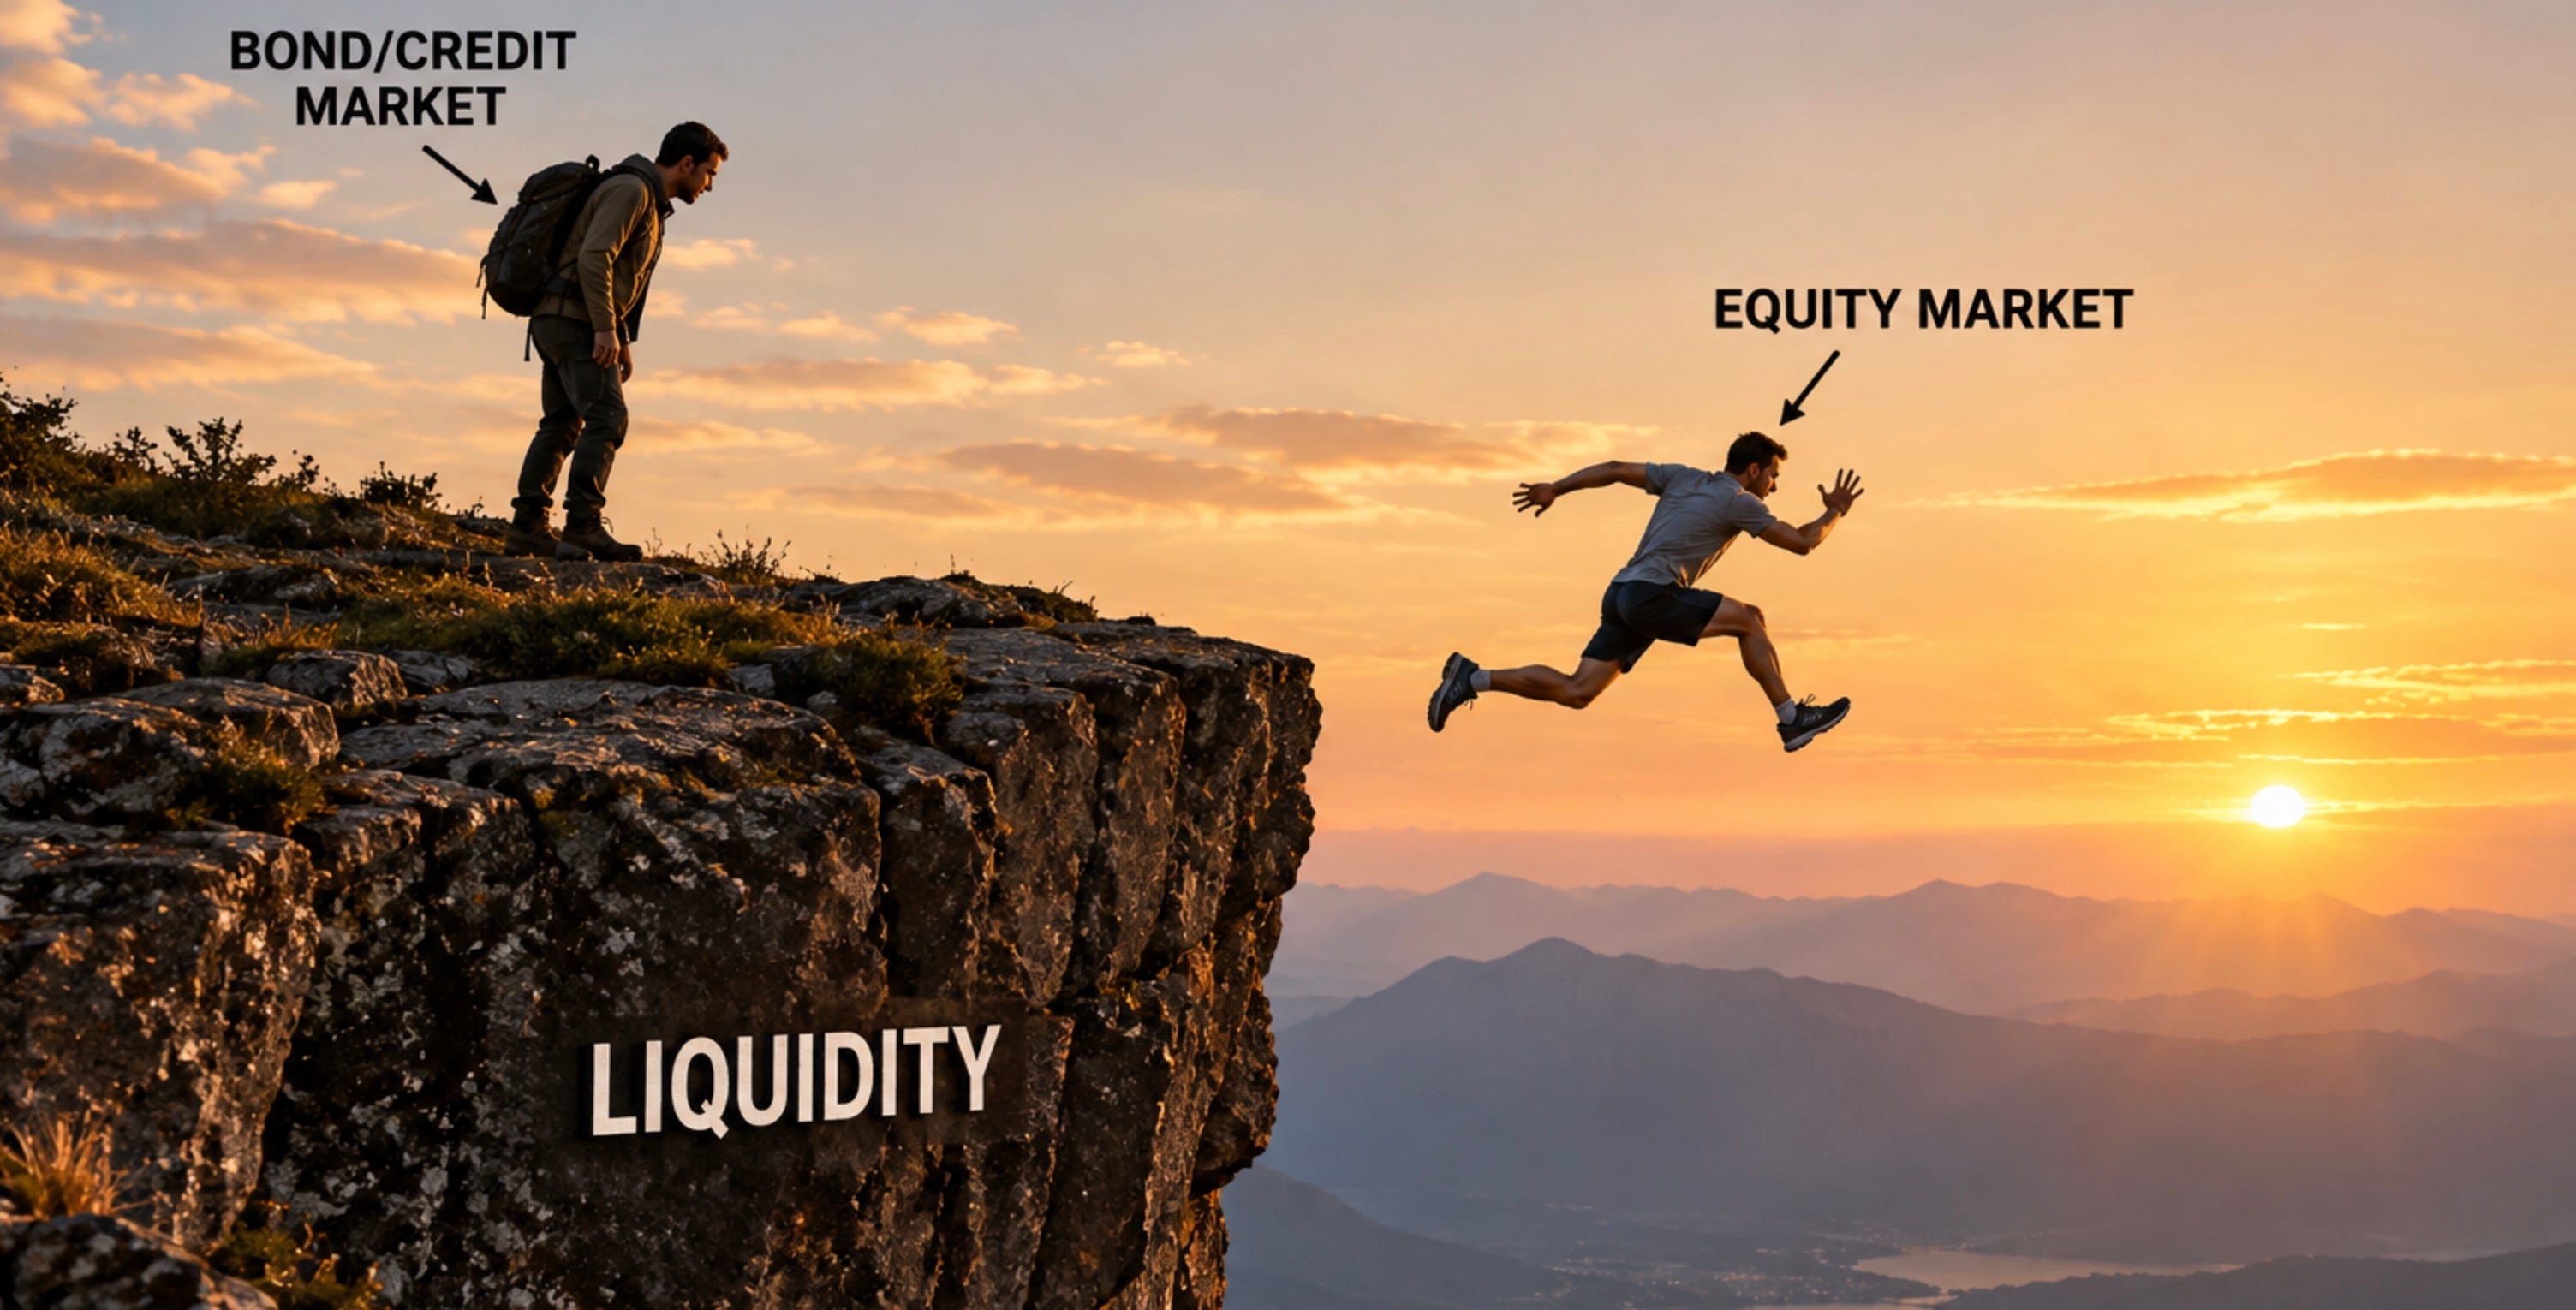
The bond and credit markets couldn’t be clearer: the AI buildout now appears to be a serious risk. The equity markets have yet to catch up.

For the better part of the last three years, the artificial intelligence trade has been built around an almost religious assumption that whatever amount of money gets thrown at AI today will eventually look trivial compared to the economic value it creates tomorrow. 

Hundreds of billions of dollars for data centers, GPUs, power generation and infrastructure have been waved through with remarkably little concern, while trillion dollar valuations have been assigned to companies burning through extraordinary amounts of cash, because the answer for bulls to almost every uncomfortable question has essentially been the same: AI is different. Bears, on the other hand, have questioned whether or not the infrastructure buildout has overshot the mark. 

Over the last several weeks something important has changed, because we are finally beginning to see what is underneath the hood, and the first look isn’t pretty. 

Yesterday may wind up being remembered as an important moment in the AI bubble because Anthropic finally gave investors something they have been conspicuously missing throughout much of this mania: actual financial statements. And they were fucking atrocious.

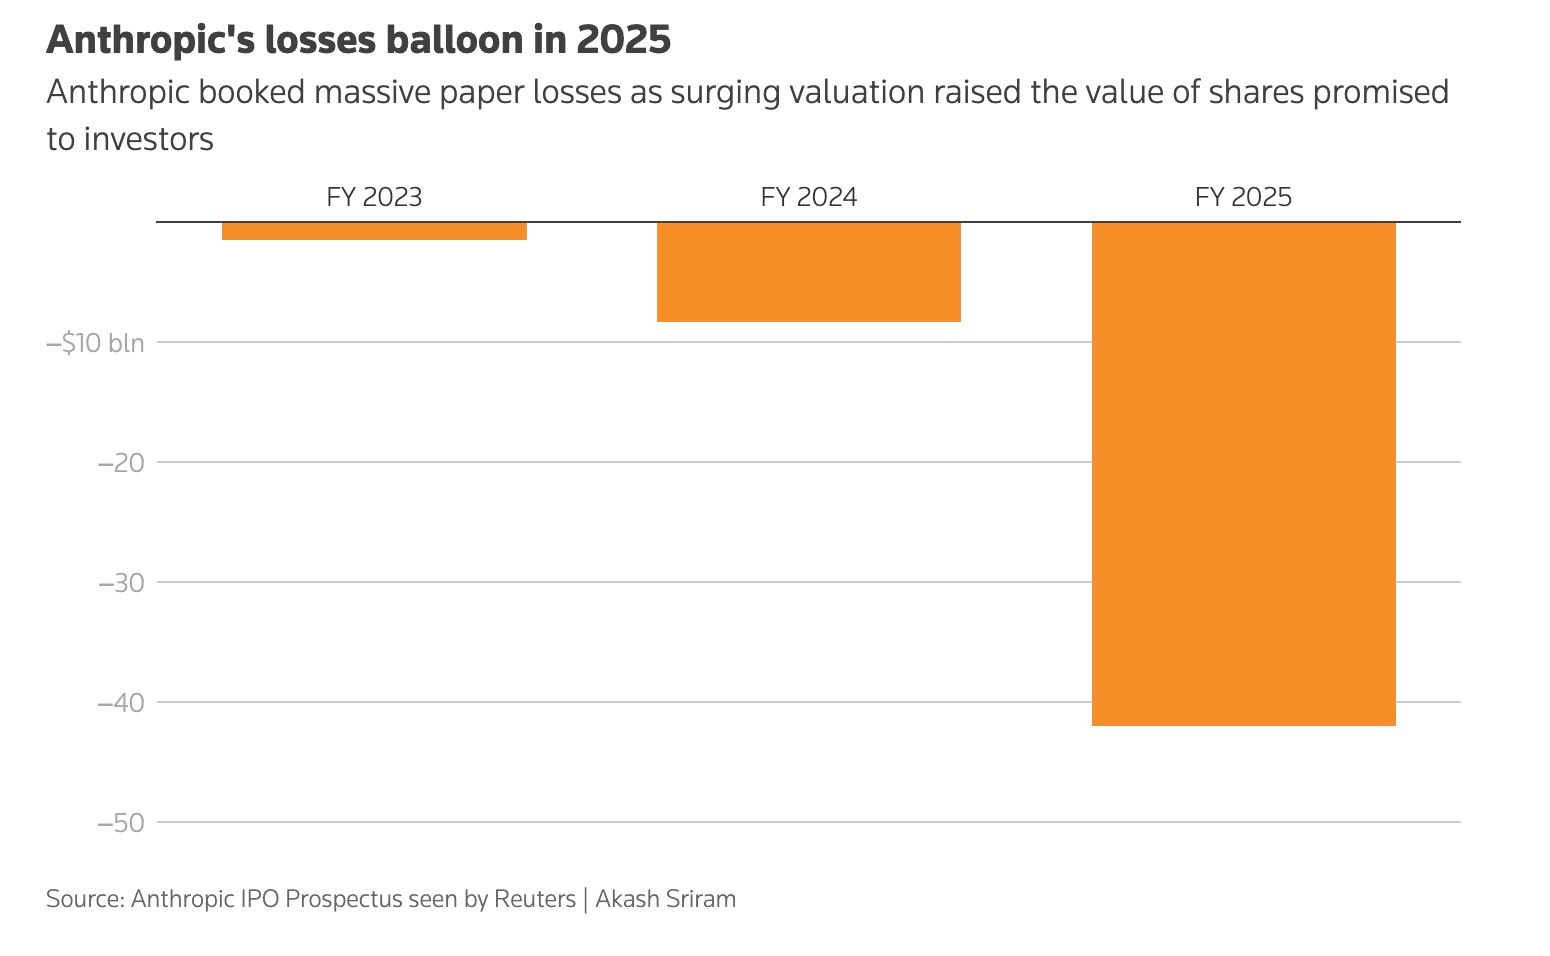
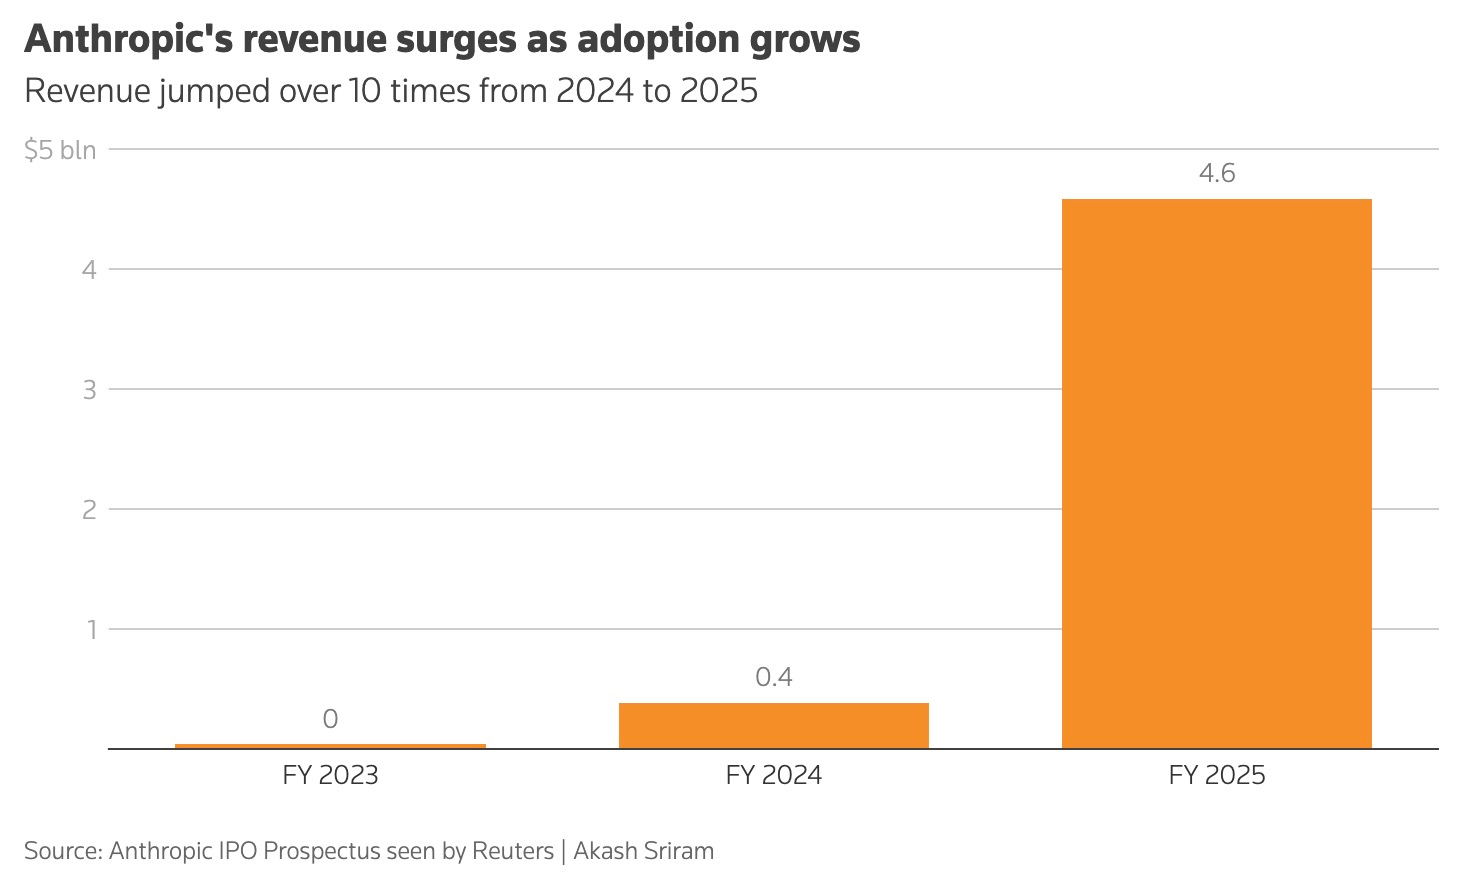
According to an IPO prospectus reviewed by Reuters, Anthropic generated roughly $4.6 billion of revenue in 2025 while posting an operating loss of more than $8 billion. 

Its reported net loss was nearly $42 billion, although roughly $34 billion of that was an accounting charge related largely to financing liabilities rather than cash burned running the business. Anthropic spent $7.33 billion on compute and infrastructure alone during 2025, roughly triple the previous year’s level, while total operating expenses reached approximately $12.65 billion. This is a company reportedly considering going public at a valuation north of $2 trillion.

Then there is the pièce de résistance. According to Reuters, Anthropic has laid out roughly $518 billion of future cloud, computing and infrastructure obligations. Half a trillion dollars. At some point investors need to stop staring at revenue growth percentages and start examining the actual machine required to produce that revenue. 

Yes, Anthropic’s growth is enormous, with revenue reportedly increasing twelvefold in 2025, but the amount of capital required to participate in this arms race is equally enormous.

To read the rest of this article and view the charts, click on the link above.

MotherSilverApe Comment: I believe that AI uses up a lot of silver!

quoththeraven.substack.com
u/Mothersilverape — 15 days ago

【Warning】Behind the Plunge in Paper Silver Prices: The "Physical Disappearance" Unfolding. Why Are Institutional Investors Secretly Emptying Their Vaults Now? X post by ⚜️Ark Gold & Silver⚜️@silver69197656Translated from Japanese

Behind the staged "crash" exceeding 5% in a single day in the futures market, unprecedented distortions at a historical level are occurring in the physical market.
We will prove with data the reality that smart money is scooping up every last ounce of silver that individual investors let go, deceived by the "illusory bearishness" on charts.

📊 1️⃣ Numbers Tell the Tale: The Catastrophic Divergence Between "Paper" and "Physical"

While short-term technical analysis buzzes about downside risks to $57–55, the abnormal fundamentals can't be hidden.

▪️ Six Consecutive Years of Structural Supply Shortage
Cumulative deficit has reached a maximum of 【800 million ounces】.

▪️ Explosive Surge in Physical Holdings
Since mid-July, total holdings in major ETFs and physical funds have risen from 781 million ounces to 【803 million ounces】 (an increase of 22 million ounces).

▪️ Activation of Negative Swap Rates
Players willing to pay borrowing fees just to secure "physical silver" are surging. Inventories in physical storage vaults are dwindling daily.

In other words, it's a structure where paper futures prices are driven down to trigger panic selling, while physical silver is quietly taken delivery of in the background.

🔋 2️⃣ Solar, EVs, All-Solid-State Batteries: The Irreplaceable "Heart of Industry"

Silver is no longer just a "precious metal." It is the absolute infrastructure of modern technology.

▪️ Annual Industrial Demand: Record High of 【680 million ounces】

▪️ Key Drivers: Solar Panels (PV), EVs, Next-Generation Batteries, Military Weapons
What's even more critical is the "inelasticity of supply."

Over 80% of silver is mined as a "byproduct" of copper, lead, and zinc, so no matter how much silver prices skyrocket, mining companies cannot ramp up production overnight.

🌏 3️⃣ Capital Flight to the East and the "2027 Disruption"

While the Western paper market cowers in fear of declines, Eastern giants are methodically stockpiling physical metal.

▪️ India's Shocking Buying Spree
Importing 【230 million ounces】 annually. Demand is expected to rise 17–18% ahead of Diwali festival.

▪️ China's "National Strategic Lockout"
Starting January 2027, China plans to impose export restrictions on physical silver. Western supply networks will be severed.

📌 Conclusion: Bullish Scenario with 60% Win Rate

Short-term, the battle rages around the $60–61 support line, but with the COMEX delivery notice day upon us, paper position settlements can no longer conceal the physical shortage.

The probability of retesting or breaking past former highs within 1–2 years stands at 【60%】.
In an era where "paper money" loses value, those who hold true physical assets will have the last laugh.

We'll supplement with deeper data on the "backside" of COMEX physical delivery (First Notice Day).

🔍 Why This Week (September 30) Marks a Turning Point for the Market?

Following the futures expiration (9/28), September 30 was COMEX's "First Notice Day." Crucially, this hinges on 【how many claims arise to exchange paper contracts for physical delivery】.

▪️ Abnormal Open Interest (OI) in October Contracts
Despite not being a delivery month, positions demanding physical withdrawal remain at unusually high levels.

▪️ Signs of a U-Shaped Recovery
Historical data patterns show that right after notice day, "paper selling pressure" drops sharply, creating prime timing for a rapid U-shaped rebound supported by physical buying.

Once institutional investors solidify the base in the "60.95–61 dollar zone," the shift to aggressive upside chasing will follow.
Will you seize this historical distortion as an opportunity, or toss it away in fear?
We'll keep tracking real-time indicators. Be sure to follow and stay tuned.

Remove space behind “h” to link to source:

h ttps://x.com/silver69197656/status/2105104624269357140?s=20

MotherSilverApe Comment: I have added a bold font to lots of points written here that I thought were less well known but still very important!

reddit.com
u/Mothersilverape — 15 days ago

Atop industrial #silver demand which continues to climb unabated,“people are realising that if gold is out of reach, silver offers a way to still participate in the precious metals rally. X post by Weimar Treasury Salesman🤠@BankerWeimar.

IBJA estimates that silver buying during this Diwali season will rise by 17-18%”

Remove space behind “h” to link to source:

h ttps://x.com/BankerWeimar/status/2105004527061434806?s=20

u/Mothersilverape — 16 days ago

👀7.58%⚠️🚨U.S. 30-Year Mortgage Rate Goes VERTICAL‼️ X post by SilverTrade @silvertrade.👀

Remove space behind “h” to link to source:

h ttps://x.com/silvertrade/status/2105024821327536632?s=20

u/Mothersilverape — 16 days ago
▲ 2 r/OccupySilver+1 crossposts

🔥SEPT COMEX SILVER DELIVERIES NEAR 35 MILLION OUNCES‼️🏦COMEX SILVER DELIVERIES REPORT🏦⚠️The CME Issued 390 Micro Silver Deliveries💥RBC Capital Issued 102 Notices💥Wells Fargo's House Account Stopped 6💥JP Morgan Stopped 17⚠️. X post by SilverTrade @silvertrade.

⚠️The CME's HOUSE Account Stopped 78!

🚨TOTAL COMEX SEPT MICRO SILVER DELIVERIES RISE TO 1,880 CONTRACTS - 1.88 MILLION OUNCES

🚨TOTAL COMEX SEPT SILVER DELIVERIES RISE TO 6,558 CONTRACTS - 32.79 MILLION OUNCES

⚠️TOTAL COMEX SEPT SILVER DELIVERIES REACH 34.67 MILLION OUNCES‼️

Remove space behind “h” to link to source:

h ttps://x.com/silvertrade/status/2103484679194104016?s=20

u/Mothersilverape — 20 days ago

🚨 Shanghai Gold Exchange (SGE) released their weekly numbers:↘️ Silver inventory down 27 metric tons last week🈳 Total silver inventory: 854 metric tons (still low.)🔥 X post by Solve Nettug @mypreciousilver.

🔥 The low inventories and the high premium over the LBMA benchmark price, proves there is a glowing demand for physical silver in China.

Remove space behind “h” to link to source:

h ttps://x.com/mypreciousilver/status/2102356505446040027?s=20

u/Mothersilverape — 23 days ago

A Decade of Higher Prices Bought Less Silver. By Sound Money Report.

Silver is down 10% on the year, and the thing that would normally fix that cannot.

Global silver mine production peaked in 2015 at 892.9 million ounces. In 2025 it was 846.6 million, about 5% lower after a decade of rising prices. Only 26% of last year’s supply came from mines whose primary product is silver, a record low on the series, with roughly three quarters arriving as a byproduct of copper, lead, zinc and gold.

Byproduct supply does not answer to the silver price. Copper’s price is what it answers to. A zinc mine does not add a shift because silver went up.

Click on the link above to read more.

soundmoneyreport.substack.com
u/Mothersilverape — 23 days ago

7 Million Ounces of Silver Left COMEX Vaults Last Week With a Spike in Deliveries By Michael Maharrey

Over 7 million ounces of silver left COMEX vaults last week as demand for physical metal surged.

Meanwhile, CME recorded 6,168 September silver delivery notices through Sept. 18, representing a "delivery" of 30.84 million ounces, according to the CME’s delivery notice and warehouse report.

To read the rest of this article, click on the link above.

linkedin.com
u/Mothersilverape — 23 days ago

One of the most striking things about this silver rally is that the 1-month lease rate is rising alongside the price. It probably means that if silver jumps to $75, physical shortages will show up almost immediately. Exciting times. X post by Karel Mercx @KarelMercx.

Remove space behind “h” to link to source:

h ttps://x.com/KarelMercx/status/2102111294354567539?s=20

u/Mothersilverape — 24 days ago