u/blandalytics

Recreating Ted Williams' Strikezone Plot
▲ 19 r/mlbdata+1 crossposts

Recreating Ted Williams' Strikezone Plot

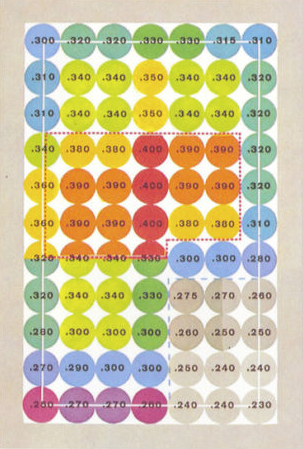
I recreated the Ted Williams strikezone plot with MLB Statcast data. You can change the notebook to show AVG (like Williams' chart does), but I default to showing wOBA for a more contemporary view of where good things happen for hitters. Code can be found in this Google Colab notebook.
u/blandalytics — 15 hours ago

Crowd-Sourced Game Score

Hey all!

We just wrapped up a fun community-based research project at Pitcher List. I made a survey app for people to assign a random starting pitcher's box score a letter grade. After 4,500+ responses, I used that data to create a simple community Game Score (methodology in the linked article):

GS = 30 + (8 * IP) - (7 * ER) + (2 * K) - (2 * BB) - H - HR

I also used the community feedback to define a letter grade distribution, which we segmented the Game Scores into.

Happy to hear any feedback or thoughts on the project. The community grade survey data can be found here, and the grading webapp I used can be found here (feel free to grade starts!).

Cheers!

u/blandalytics — 3 months ago