▲ 1 r/Nauma
Nauma Blog: When Relying on Federal Tax Brackets in a Roth Conversion Optimizer Can Be Misleading
Strategically moving assets from tax-deferred accounts, such as traditional IRAs or 401(k)s, into tax-free Roth accounts may reduce future Required Minimum Distributions (RMDs), lower a family’s total lifetime tax bill, and reduce taxes when passing wealth to heirs.
But doing this manually is incredibly difficult. Roth conversions require setting aside funds in taxable accounts to pay the resulting taxes, especially if the conversions are done before age 59½. This creates additional pressure on taxable accounts and may lead to liquidity issues if the family stopped working early. A family may find itself in a situation where it technically has assets, but those assets are not available to cover current needs because they are held in illiquid retirement accounts, deferred compensation, real estate, or PE/VC funds.
For people over age 59½, the main challenge often comes from health insurance. They may need to keep MAGI, or Modified Adjusted Gross Income, below certain thresholds to qualify for ACA premium subsidies and avoid IRMAA surcharges when they switch to Medicare.
In both cases, it can be hard to tell whether Roth conversions actually increase family wealth because a direct comparison is often not straightforward: assets in tax-deferred accounts are not equivalent to assets in tax-free accounts.
If you do Roth conversions without a clear strategy, you are left in the dark about whether the strategy is actually optimal.
Roth Conversion Optimizer
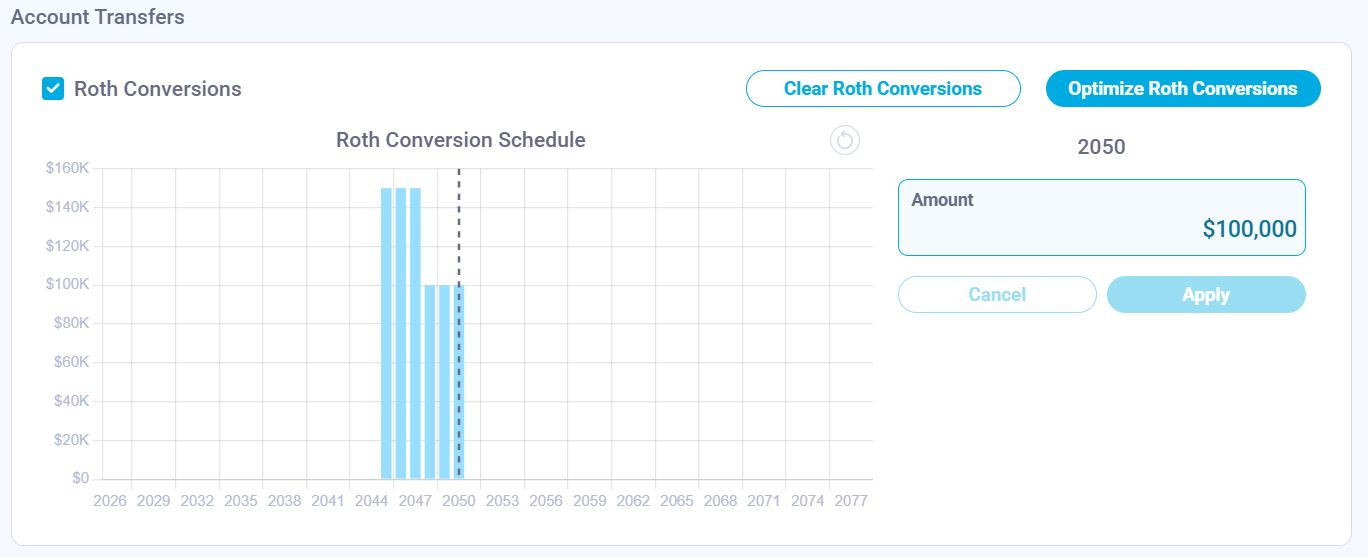
To solve this, we just built a new feature: the Roth Conversion Optimizer. We have added an “Optimize Roth Conversions” button directly inside your financial projection dashboard. When you click it, the system prompts you to choose an optimization strategy. Currently, the platform supports the Tax Brackets strategy.
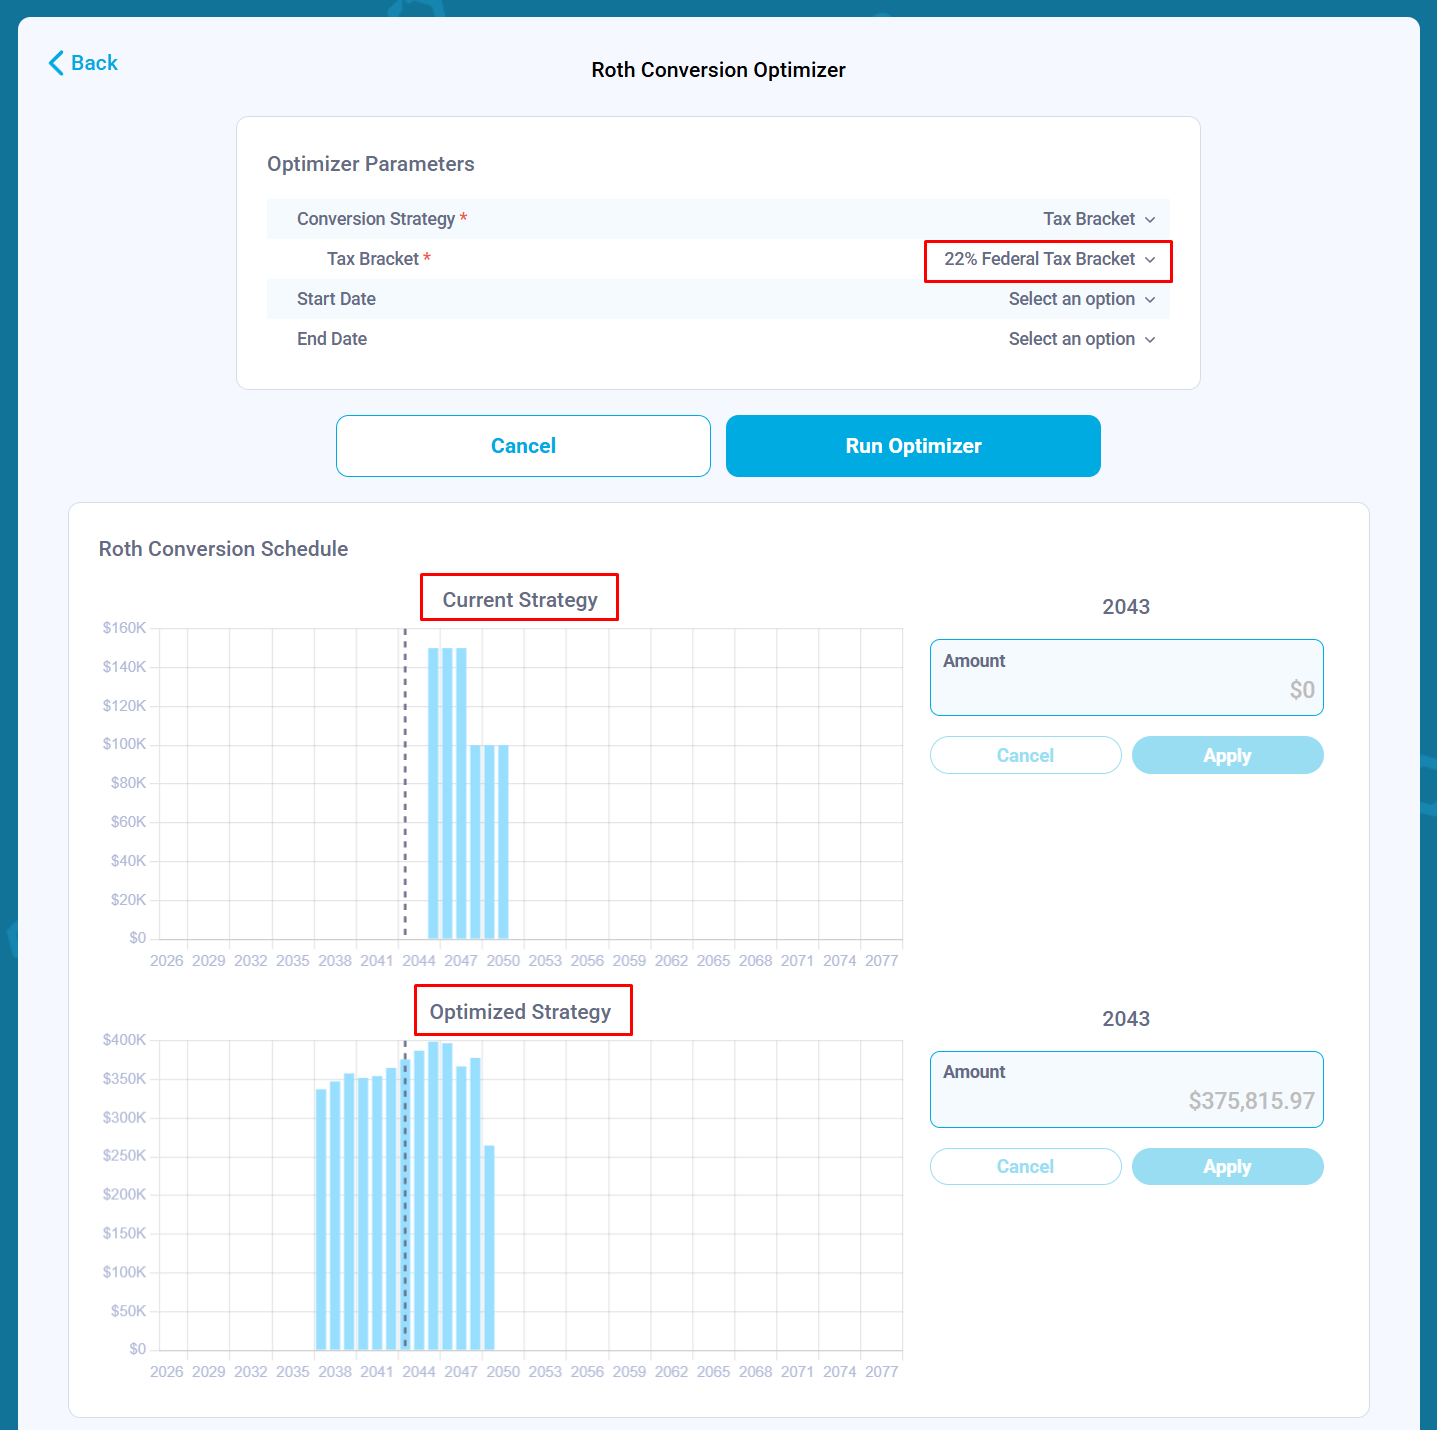
When you select this strategy and input a target federal tax bracket (for example, 22%), our solver runs a binary search algorithm across the years between your specified start and end dates. It automatically calculates the exact amount needed to increase your taxable income and execute Roth conversions right up to the ceiling of that specific federal tax bracket.
However, as we rolled this tool out, it highlighted a financial planning lesson: blindly optimizing for federal tax brackets, one of the most common approaches in financial planning tools, and ignoring state and foreign taxes can backfire and cost millions of dollars.
Problem #1: The Interstate Move (California to Florida)
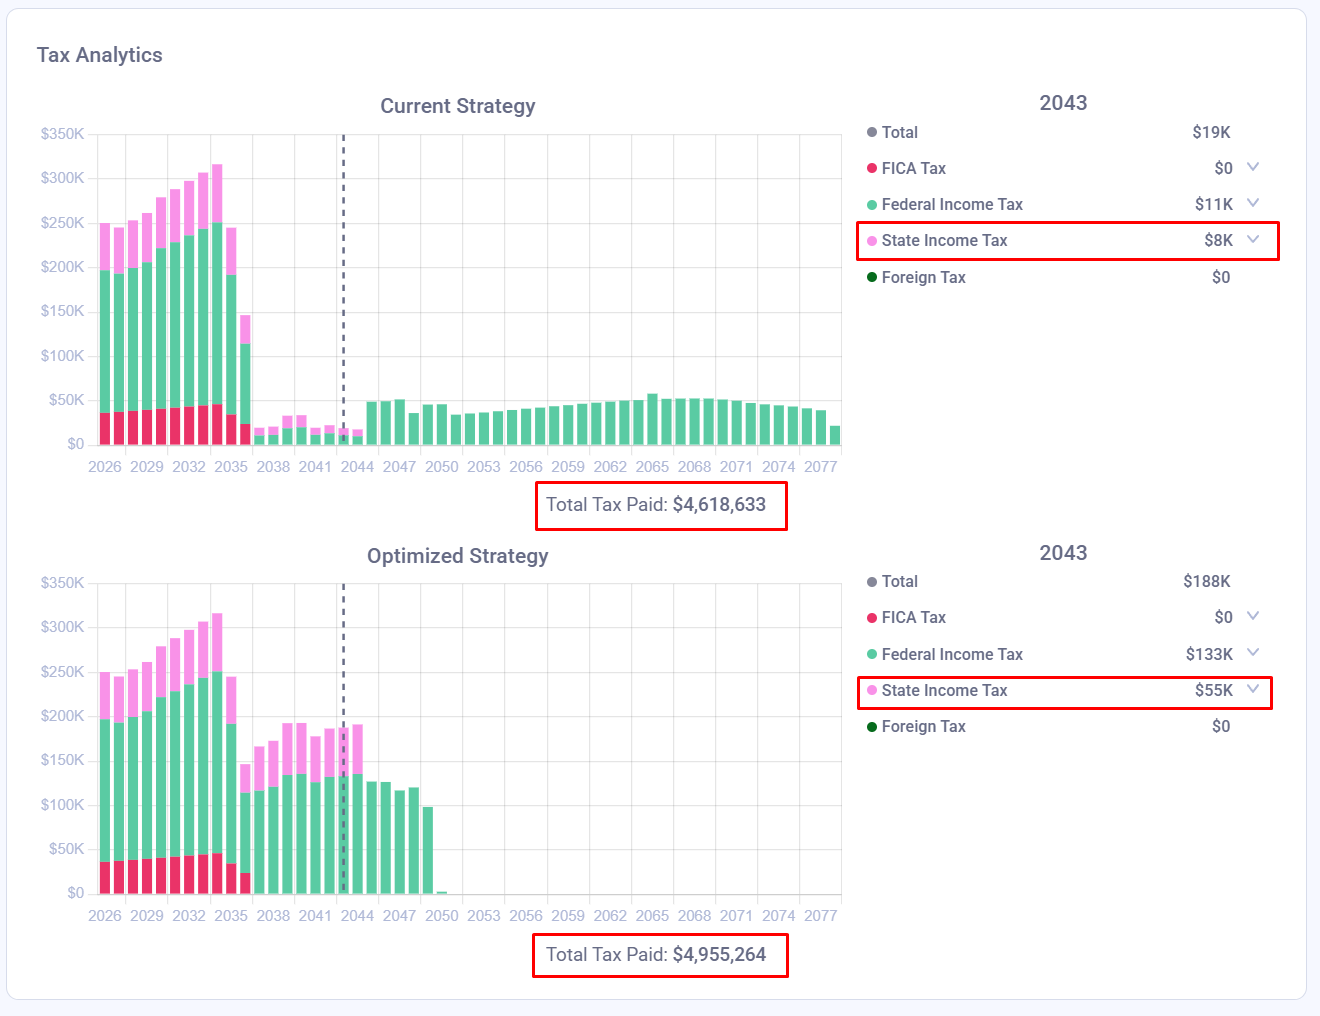
To see why optimizing solely for a federal tax bracket can backfire, let’s look at a case study of a family currently living in California that plans to relocate to Florida in 2045. If we blindly run the optimizer to fill the 22% federal tax bracket across the entire projection, the results look highly counterintuitive:
Current Strategy: Manual Roth Conversions
- Total lifetime tax paid: $4.6 million
- Terminal net worth: $29.5 million
Optimized Strategy: Filling the 22% Federal Bracket
- Total lifetime tax paid: $4.9 million
- Terminal net worth: $25.1 million
Why did an “optimizer” make this family $4.4 million poorer?
Because the family lives in California before 2045, accelerating income through early Roth conversions subjects them to California’s high progressive state tax rates. During the conversion years, their state tax bill increases from a baseline of $14,000 to nearly $60,000. Since they plan to move to tax-free Florida later, accelerating income while still living in California destroys value. The direct tax cost is higher, and the assets used to pay those taxes no longer remain invested and compounding.
Problem #2: The Expat Double-Tax Friction (Retiring Abroad)
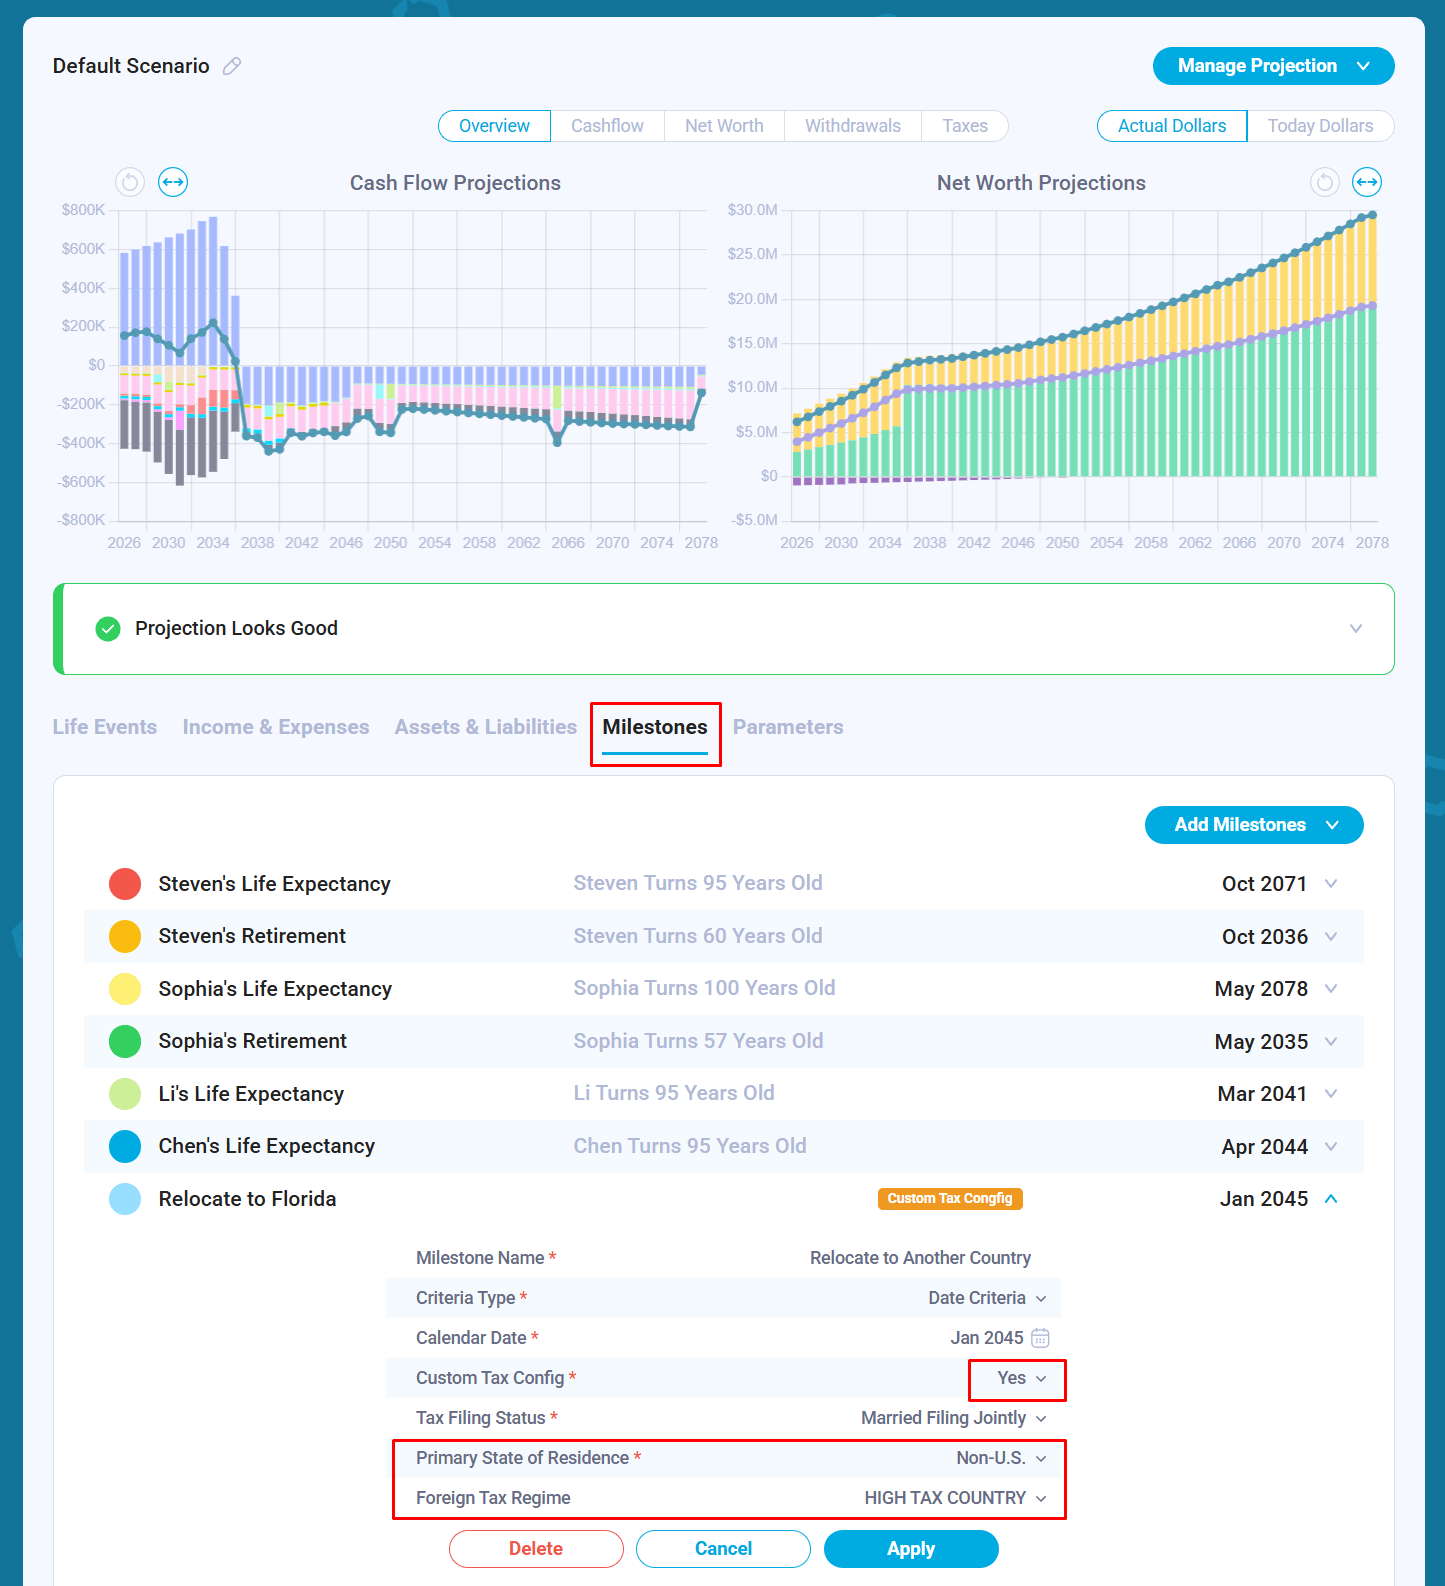
The problem becomes even more pronounced for families planning to leave the U.S. and retire abroad. Let’s look at another example. Instead of moving to Florida, the family decides to relocate to a country with a high-tax regime, such as a flat 20% income tax rate starting at the first dollar of income, with no standard deduction.
Because they are U.S. citizens, they remain subject to U.S. federal income tax on their global income, including Roth conversions. At the same time, they may also be subject to the local tax laws of the foreign country.
When we run the 22% federal bracket optimizer on this international track, the numbers look like this:
Current Strategy: Manual Roth Conversions
- Total lifetime tax paid: $7.8 million
Optimized Strategy: Filling the 22% Federal Bracket
- Total lifetime tax paid: $6.3 million
At first glance, you might think, “Great! The optimizer saved them $1.5 million in taxes.” But that conclusion would be premature. The solver is still blind to the international context. It is only looking at U.S. federal tax brackets and ignoring the 20% foreign tax overlay. It does not account for how the destination country treats Roth conversions, whether that country recognizes the tax-free status of Roth accounts, or how foreign tax credits apply.
Using a standard, single-dimensional federal bracket optimizer when relocating abroad is a roll of the dice. It may produce a good result, or it may create an unexpected global tax bill.
A federal tax bracket optimizer may work reasonably well for families who plan to retire in their current tax environment. Families considering interstate moves or retirement abroad should be much more careful.
Verifying Roth Conversions
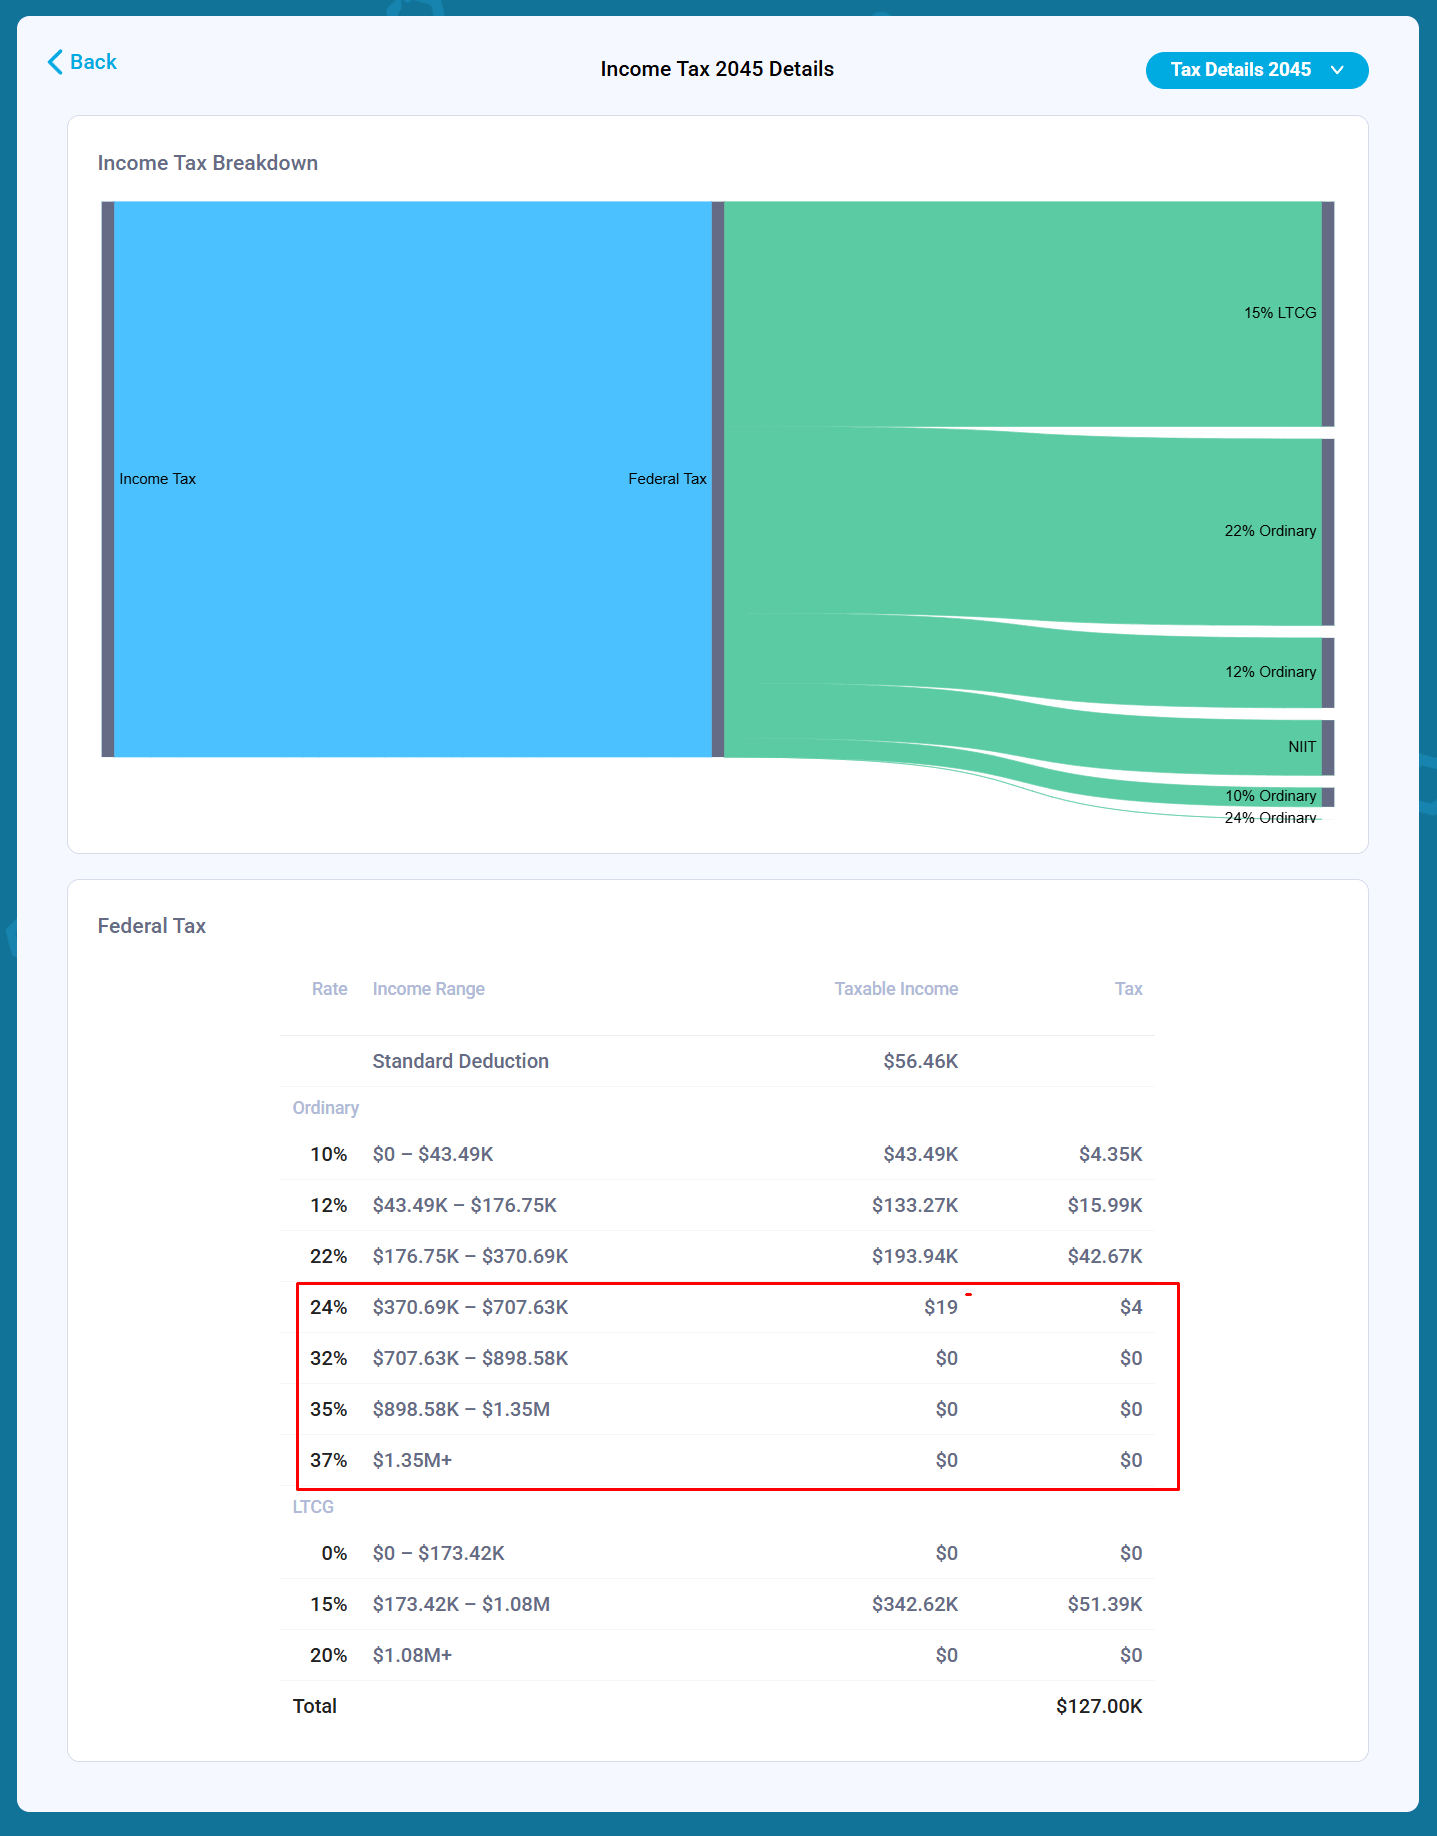
If you choose to apply an optimized strategy, you can audit the tool’s precision by clicking into any specific year on your timeline and reviewing the granular tax details. If you set the target bracket to 22%, you should generally see no taxable income above the 22% tax bracket in the year the optimizer adds a Roth conversion.
You may occasionally notice a tiny amount, such as $27 or $50, appearing in the next highest tax bracket. This is by design. To maintain high performance, our solver uses a binary search algorithm with a precision threshold of $100. The algorithm stops searching once it gets within $100 of the target, which means a small number of dollars may spill into the next bracket.
If you require absolute, single-dollar precision for your models, let us know and we can tighten the threshold.
What We Are Building Next: Terminal Wealth Optimization
This feature illustrates well why standard, single-dimensional federal tax bracket optimization is an incomplete tool for high-net-worth families with dynamic lives. True financial optimization cannot look at federal brackets in isolation.
To build a more robust optimization engine, we are developing a solver that optimizes against Terminal Wealth: maximizing the exact amount of money you have left at the end of your life expectancy. To do that, the next iteration of our optimizer will factor in the comprehensive, multi-jurisdictional tax picture simultaneously:
- Federal Income Taxes
- Progressive State Income Taxes
- Foreign/Expat Tax Treaties and Local Rates
By calculating how these compounding layers interact with specific life events, such as moving states or retiring abroad, Nauma will be able to estimate the net impact of cross-border tax friction on a family’s portfolio and solve for a more efficient Roth conversion strategy.
u/alex_nauma — 7 days ago
▲ 2 r/Bogleheads
Roth Conversion Math: What tax rate do you use to calculate Terminal Wealth?
I’m modeling a multi-year Roth conversion schedule and trying to calculate total "Terminal Wealth" at the end of the timeline (e.g., age 90) to see if the conversions actually win against the baseline.
To do a fair apples-to-apples comparison, you have to discount the pre-tax (Traditional) balance to its true after-tax value at the very end of your spreadsheet.
For those who DIY your retirement models, what tax rate are you applying to that final pre-tax bucket?
- Are you using a projected marginal rate, or a blended effective rate?
- Are you using your own future brackets, or guessing your heirs' tax brackets because of the SECURE Act 10-year rule?
- Do you adjust for the "widow/widower penalty" (switching the end-of-life brackets to Single)?
Curious to hear how you handle the math on this specific variable without overcomplicating things. Thanks!
u/alex_nauma — 13 days ago
▲ 1 r/Nauma
Nauma Blog: Exchange Funds and Expected Market Returns
The challenge with using swap (exchange) funds is that the highest demand happens during booms like the one we experience today: successful company’ stocks appreciate to levels that make many employees uncomfortable having their wealth concentrated in one name. But the benefit of using exchange funds highly depends on the expected stock market returns, which are normally lower over the next 5-15 years after a boom.
Consider an example: concentrated stock value = $1.5M, cost basis = $885K, current and future LTCG tax rate are expected to be the same = 30.8% (20% federal + 3.8% NIIT + 7% WA State). Expected Market Return = 12.38%, expected Volatility = 15.43% (S&P 500). Duration = 7 years (standard IRS requirement)
We consider two scenarios:
- Exchange fund: the investor uses an exchange fund, waits seven years, and then sells everything to get cash.
- Simple sell: the investor sells the stock now, invests in a diversified portfolio, waits seven years, and then sells again.
We finish both scenarios with a full liquidation to make them comparable.
Monte Carlo P50 (median market returns) gives us:
- Simple Sell Scenario = $2.46M
- Exchange Fund = $2.54M
- Exchange Fund Benefit = $80K
Monte Carlo P5 (Pessimistic Market Returns) gives us:
- Simple Sell Scenario = $1.46M
- Exchange Fund = $1.43M
- Exchange Fund Benefit = -$28K
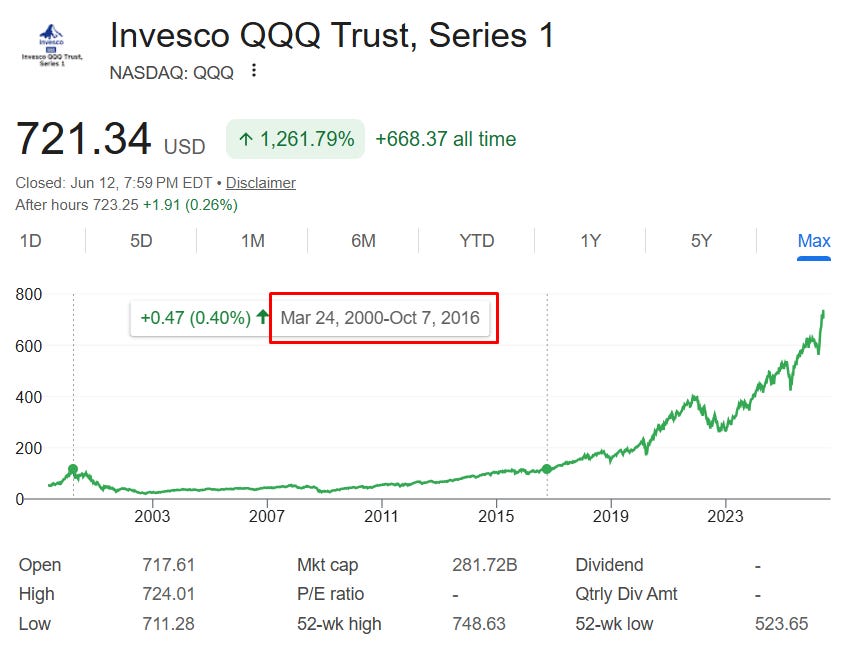
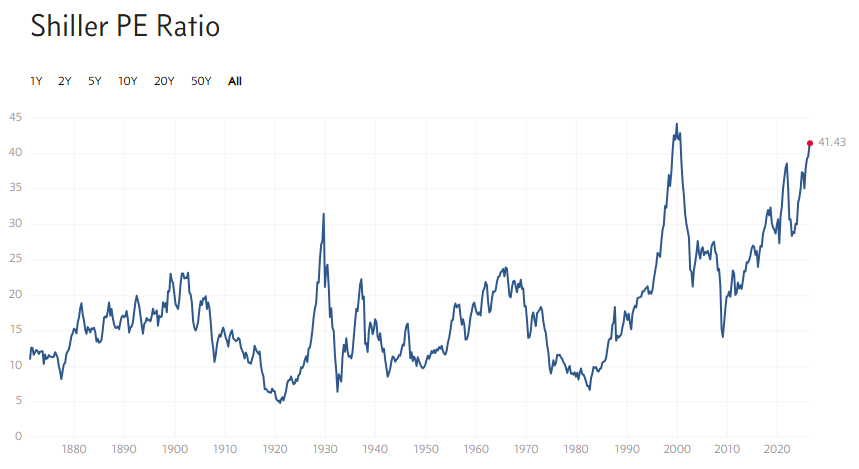
Between 2000 and 2016, QQQ remained flat, with a 0% return. Today, the Shiller P/E ratio, or cyclically adjusted price-to-earnings ratio, is at a level comparable to the dot-com bubble, which makes some people believe that investment returns will be lower over the next five to ten years.
At that level of return, exchange funds may add very little value compared to simply selling.
With all that said, there is a problem with this thinking: by adding the sell step at the end of the seven-year period to make both scenarios comparable, we oversimplify the problem. In reality, people who use exchange funds get optionality: they can continue to manage that position and diversify without triggering taxes in the future, especially if they stop working during that period and gain access to the 0% LTCG tax bracket. People who sell appreciated stock today don’t have that privilege: they lock in their gains and pay the taxes today.
Tax-efficient diversification is not a one-time solution, but a multi-year process.
u/alex_nauma — 16 days ago
VEP offered. $4M NW. Why am I still hesitating?
I'm 49. Tech worker. Bay Area.
My company just announced a Voluntary Exit Program and for the first time I'm seriously considering taking it.
Current numbers:
Age: 49
Net worth: ~$4.1M
House: paid off
No debt
Annual spending: ~$130k
Portfolio: ~80% stocks, 20% cash/bonds
2 kids
The package would give me roughly 5 months of pay plus healthcare coverage for a while. On paper, this feels like a no-brainer. The weird part is that I never planned to stop working this year. I've spent 20+ years optimizing for savings, promotions, RSUs, bonuses, and suddenly someone is offering me money to leave. Part of me thinks this is the cleanest exit I'll ever get. The other part keeps asking: what if the market drops? What if I get bored? What if I regret walking away from peak earning years? For people who actually took a VEP or similar package: was it obvious when you made the decision, or did it feel terrifying right up until you signed? Looking for a reality check from people who've already crossed this bridge.
u/alex_nauma — 17 days ago
▲ 2 r/Nauma
Our users asked us to add Roth conversions this week
This is the first version, and it doesn’t include an optimizer yet, but it’s pretty fun to play with the engine and see how Roth conversions affect assets in taxable, tax-deferred, and tax-free accounts.
u/alex_nauma — 18 days ago
▲ 25 r/Retire
The Safe Withdrawal Rate: Do You Need Bonds in Retirement?
Karsten Jeske did a great analysis of safe withdrawal rates on his blog and created this table by writing a script that loops through all possible combinations of retirement dates and estimates the probability of a portfolio not running out of money using a constant withdrawal rate between 3.00% and 5.00% (inflation-adjusted).
Karsten used historical stock and bond returns from 1871 to 2016 and tested his model across different stock/bond allocations: 0%, 25%, 50%, 75%, and 100% stocks, as well as different retirement durations: 30, 40, 50, and 60 years. While the information is dense, the table is highly readable and uncovers great insights:
- The more stocks the portfolio has, the higher the chances of it not running out of money given all other factors the same.
- The 0% stock portfolio performs poorly across almost all longer horizons.
- Going from 4.00% to 5.00% may sound like a small change, but the success-rate drop can be large.
One of the most common questions people ask when they look at this table is: “If portfolios with 0% bond exposure have historically had a higher chance of surviving, why don’t we use them and simply ignore bonds in retirement?”
It’s a legitimate question.
Traditional Retirement Portfolios
While historical data over multi-decade horizons demonstrates that equities provide better long-term compounding and frequently yield higher mathematical success rates, institutional wealth management continues to use bonds in retirement portfolios for the following reasons:
1. The Mitigation of Sequence of Returns Risk (SRR)
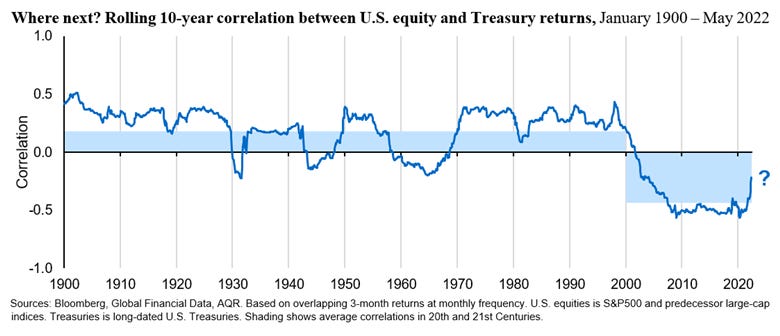
If a market crash happens while we are saving for retirement, it creates a buying opportunity. But if a crash happens right after we retire, we are forced to sell stocks at a loss to pay for living expenses. This permanently shrinks the portfolio and makes it incredibly hard to recover. Bonds act as a financial cushion, allowing us to spend fixed income during a downturn while giving the stocks time to bounce back.
Historically, bonds have demonstrated low or negative correlation to equities. Adding bonds in the portfolio increases risk-adjusted returns and chances of not running out of money in retirement.
2. Behavioral Finance and Capitulation Risk
While the Karsten spreadsheet model assumes a perfectly rational agent who can withstand a 50% drop in net worth without altering their strategy, real-world wealth management must account for human psychology. This introduces capitulation risk: the probability that an investor will panic during a prolonged market crash and liquidate their portfolio at or near the absolute bottom.
Portfolio Glide Path in Financial Models
When we look at Karsten’s table, we are looking at static allocations. The model assumes you pick one specific asset mix like 100% Stocks or 50% Stocks and blindly hold it for 30 to 60 years.
This creates a frustrating financial paradox:
- If you go 100% Stocks: You maximize long-term compounding, but you expose yourself to a catastrophic Sequence of Returns Risk in the first few years of retirement.
- If you go 50% Stocks: You protect yourself against a near-term crash, but over a 50-to-60-year retirement, your success rate plummets because your portfolio lacks the growth engine required to outpace long-term inflation.
But what if you didn’t have to choose a static row? What if your portfolio could adapt dynamically over time? Instead of keeping asset allocation locked, a portfolio glide path dynamically shifts your exposure based on where you are in your retirement timeline. You can pick a more aggressive allocation If you are a 10+ years away from your retirement, and reduce portfolio stock exposure over time as you get closer to the time when you need the money.
Karsten introduces Rising Equity Glide Path (or Bond Tent) in his safe withdrawal rate series. He argues that the investor can enter retirement conservative (e.g., 60/40) to survive Sequence of Returns Risk, and then increase equity exposure (gliding back up to 80% or 100% stocks) inside retirement.
Stock Only vs Custom Portfolio Glide Results
Designing a portfolio glide path is an individual decision based on the investor’s risk tolerance and financial plans. The results will heavily depend on the family’s net worth, future income and expenses, and taxes.
To see how these dynamics play out, we ran a hypothetical scenario:
- Family M49 and F48. Live in California. Two kids (11 and 14)
- Net Worth $6M ($2.4M taxable, $1.6M Tax-Deferred, and $490K in tax-free accounts)
- Current Income $720K, Total expenses $254K, taxes $250K
- They currently plan to work for another 8 years
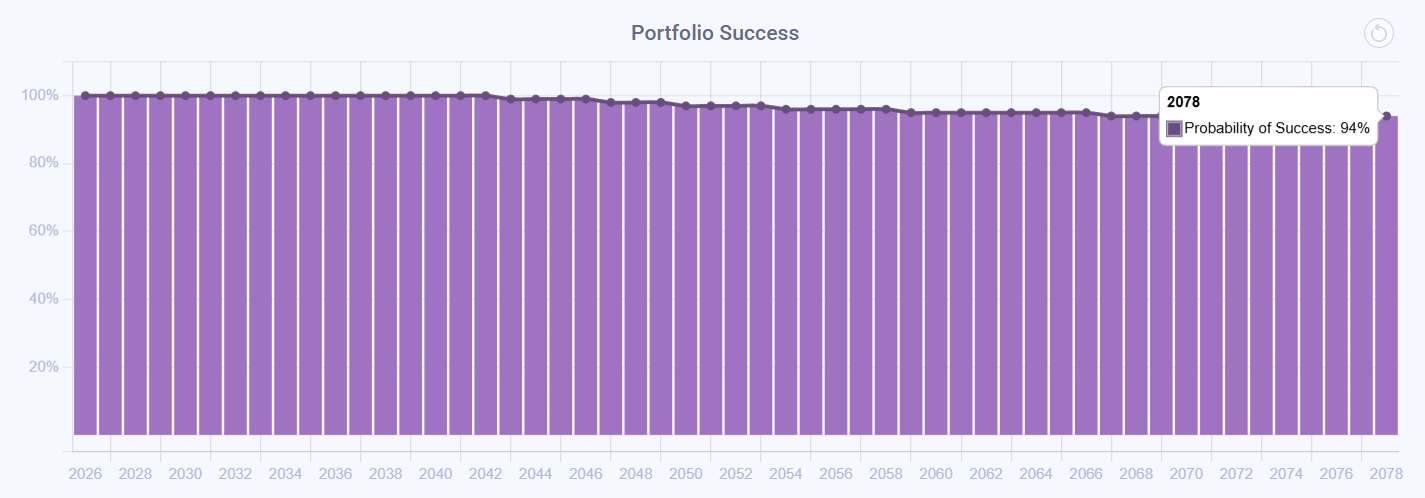
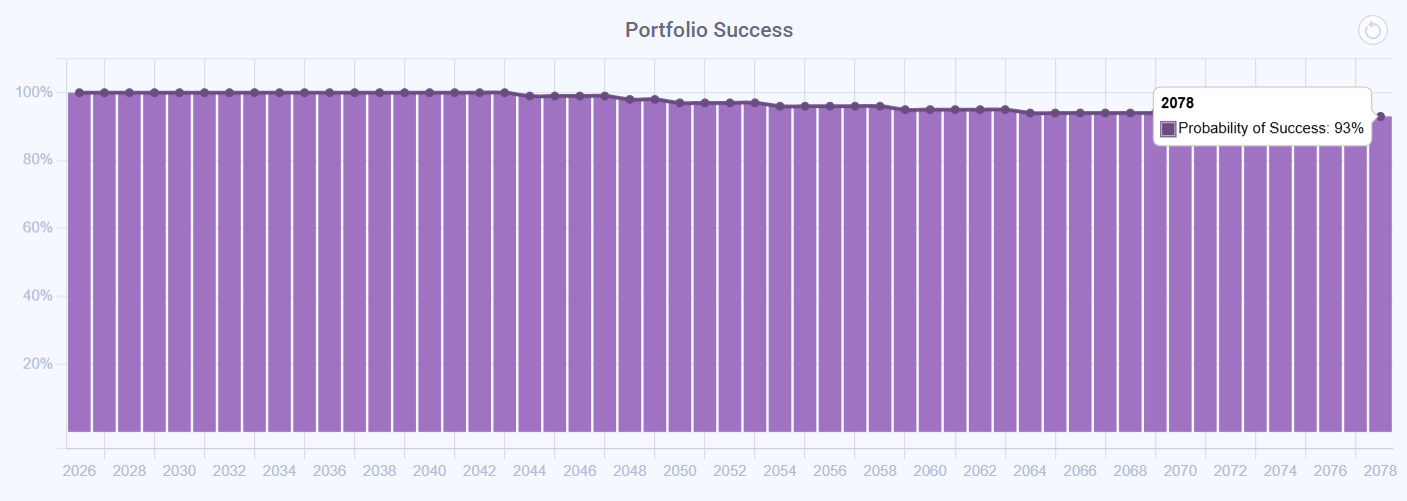
The results are quite interesting. For their retirement fund, the Aggressive portfolio (95% equity, 5% cash) had a 94% success rate when tested in a Monte Carlo simulation, while a Portfolio Glide Path (95% equity → 60% equity for the rest of the plan) had a 93% success rate. This is in line with Karsten’s findings, despite some differences in the market data. Karsten used data from 1871 to 2016, while Nauma uses data from 1992 to the present.
Aggressive Portfolio:
Portfolio Glide Path:
While the overall success rates appear nearly identical, looking under the hood at the distribution of outcomes reveals the true strategic trade-off.
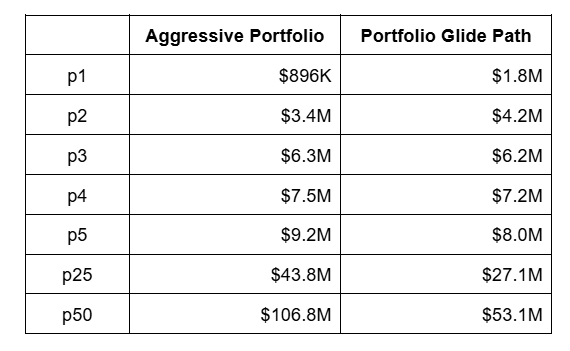
At the overall household level (Module 4) where all financial goals are blended together, the Aggressive portfolio showed better results across all percentiles except p1 and p2. To clarify, the p1 percentile means that among 10,000 Monte Carlo simulation runs, 99% of runs, or 9,900 runs, demonstrated better performance.
The table below illustrates the projected ending value of the entire blended household portfolio across different simulation percentiles:
With this data, the family can now make a significantly more informed decision about whether they want to use a Portfolio Glide Path or stick with an Aggressive, equity-heavy portfolio.
When using the Portfolio Glide Path, the simulation demonstrated greater resilience in worst-case economic scenarios, such as the 2000 Dot-Com bust or the 2008 Financial Crisis, resulting in improved p1 and p2 metrics. The opportunity cost of that downside protection, however, is a roughly 2x lower median portfolio value at the end of their financial plan ($53.1M vs. $106.8M).
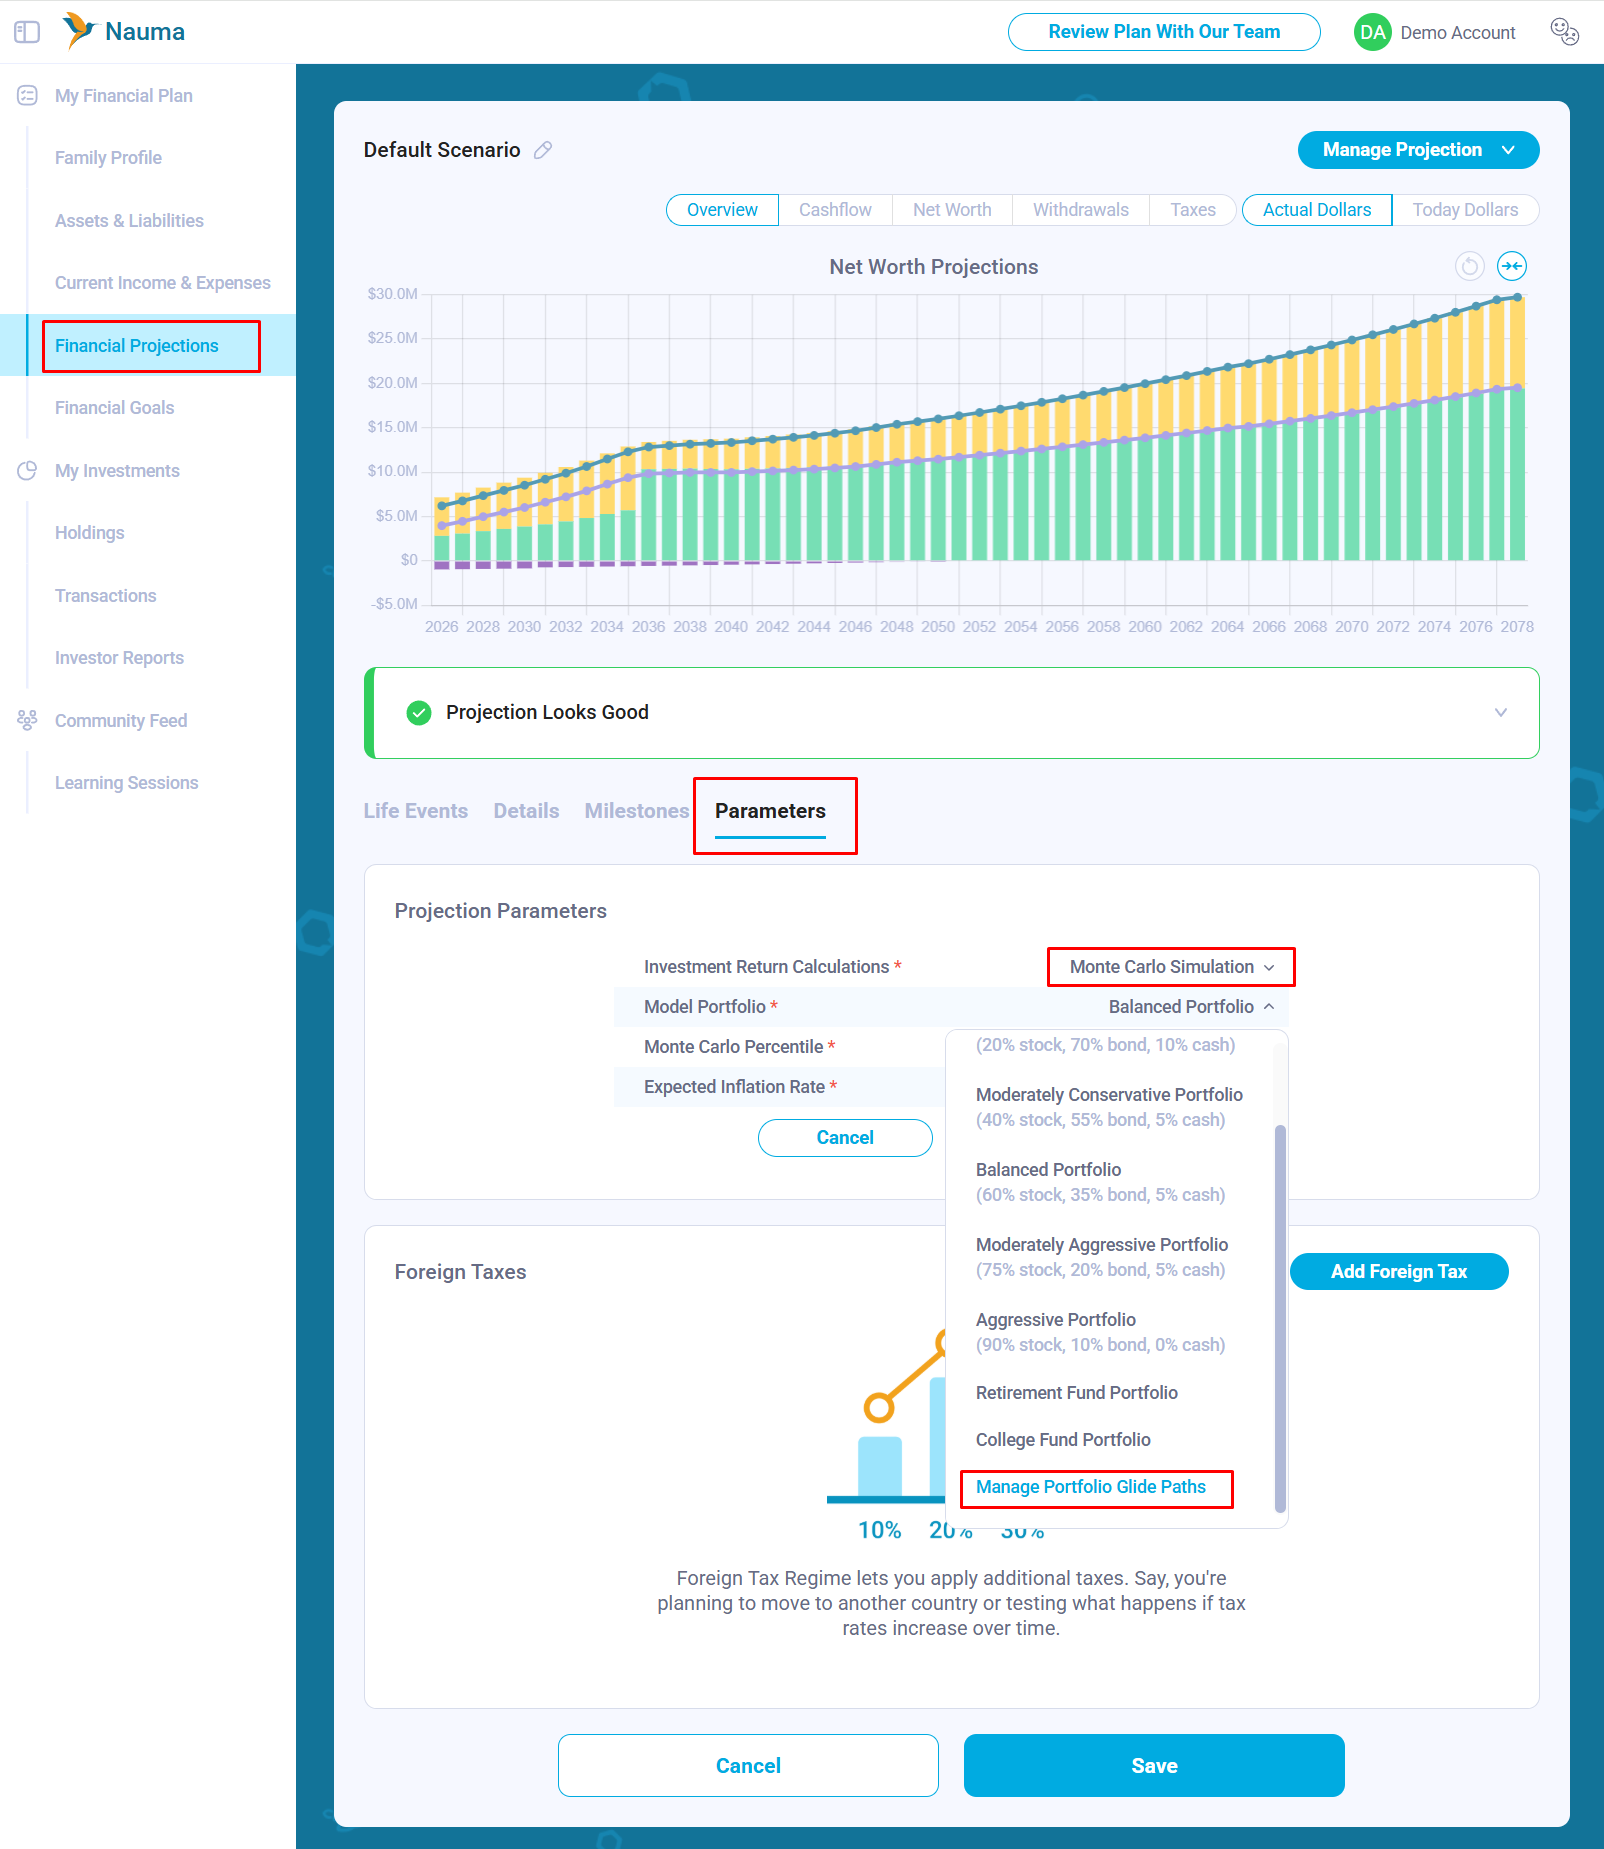
How to Configure Portfolio Glide Paths
There are two options for how you can configure your own Portfolio Glide Path in Nauma.
The platform offers planning at both the household and goal levels and provides two ways to create and manage custom portfolio glide paths. If you are working on your financial projection in Module 4, go to Parameters, set Investment Return Calculations to Monte Carlo Simulation, and then select Manage Portfolio Glide Paths in the newly appearing Model Portfolio field.
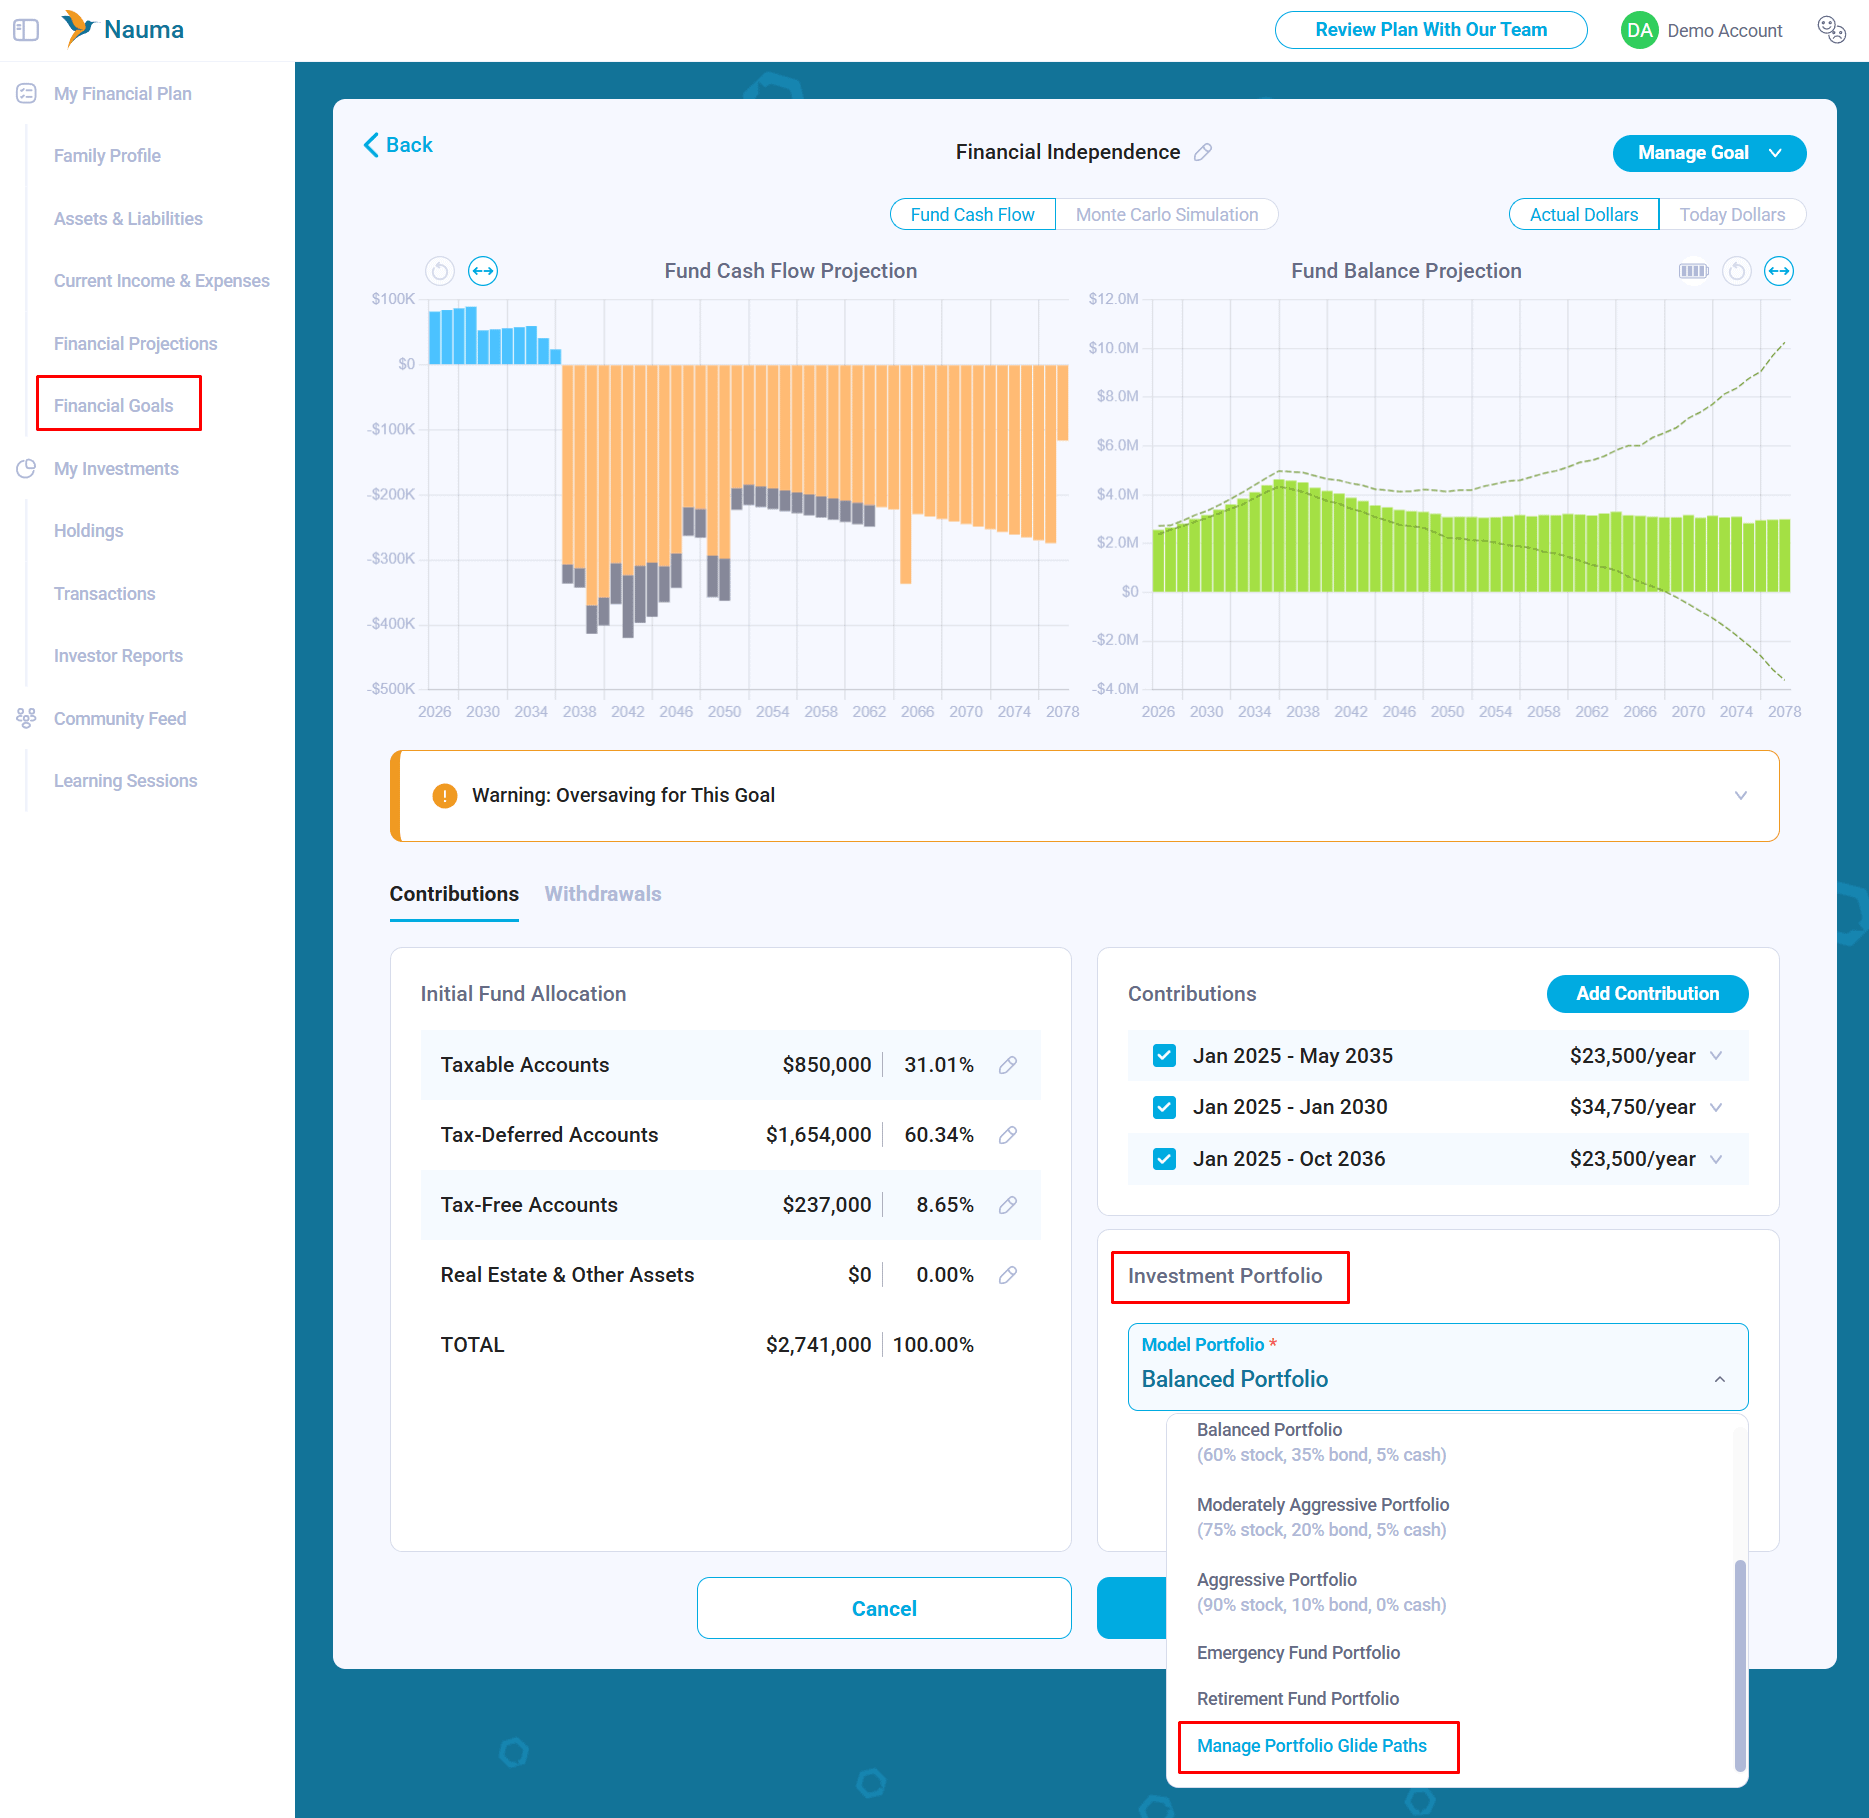
If you are setting your financial goals in Module 5 and working at the fund level, click the Model Portfolio dropdown and scroll down to Manage Portfolio Glide Paths.
Portfolio Glide Paths are owned by the Financial Projection and shared across Module 4 and Module 5. This means you can reuse a Portfolio Glide Path created in your financial projection later when you start working on your financial goals.
Context Over Cookie-Cutter Advice
Generic financial advice is almost always engineered for the lowest common denominator, pushing conservative allocations because they must work safely for the masses. But high-net-worth tech families often possess unique cash flow structures, equity compensation buffers, and higher personal risk tolerances that make equity-heavy strategies a natural avenue to explore for them.
The main challenge for these families is not knowing their true risk tolerance unless they have already lived through several market cycles and seen how they actually react. Most people know, intellectually, that they should not sell when the market crashes. They answer risk-tolerance questionnaires logically and describe what they would do in a hypothetical downturn. But when a real market crash happens, emotions often take over, and people make very different decisions.
Adding non-correlated assets, such as bonds or managed futures, may reduce portfolio volatility and help investors avoid panic selling. But that benefit comes at a cost.
u/alex_nauma — 25 days ago
▲ 4 r/Nauma
Nauma Blog: The Safe Withdrawal Rate: Do You Need Bonds in Retirement?
Karsten Jeske did a great analysis of safe withdrawal rates on his blog and created this table by writing a script that loops through all possible combinations of retirement dates and estimates the probability of a portfolio not running out of money using a constant withdrawal rate between 3.00% and 5.00% (inflation-adjusted).
Karsten used historical stock and bond returns from 1871 to 2016 and tested his model across different stock/bond allocations: 0%, 25%, 50%, 75%, and 100% stocks, as well as different retirement durations: 30, 40, 50, and 60 years. While the information is dense, the table is highly readable and uncovers great insights:
- The more stocks the portfolio has, the higher the chances of it not running out of money given all other factors the same.
- The 0% stock portfolio performs poorly across almost all longer horizons.
- Going from 4.00% to 5.00% may sound like a small change, but the success-rate drop can be large.
One of the most common questions people ask when they look at this table is: “If portfolios with 0% bond exposure have historically had a higher chance of surviving, why don’t we use them and simply ignore bonds in retirement?”
It’s a legitimate question.
Traditional Retirement Portfolios
While historical data over multi-decade horizons demonstrates that equities provide better long-term compounding and frequently yield higher mathematical success rates, institutional wealth management continues to use bonds in retirement portfolios for the following reasons:
1. The Mitigation of Sequence of Returns Risk (SRR)
If a market crash happens while we are saving for retirement, it creates a buying opportunity. But if a crash happens right after we retire, we are forced to sell stocks at a loss to pay for living expenses. This permanently shrinks the portfolio and makes it incredibly hard to recover. Bonds act as a financial cushion, allowing us to spend fixed income during a downturn while giving the stocks time to bounce back.
Historically, bonds have demonstrated low or negative correlation to equities. Adding bonds in the portfolio increases risk-adjusted returns and chances of not running out of money in retirement.
2. Behavioral Finance and Capitulation Risk
While the Karsten spreadsheet model assumes a perfectly rational agent who can withstand a 50% drop in net worth without altering their strategy, real-world wealth management must account for human psychology. This introduces capitulation risk: the probability that an investor will panic during a prolonged market crash and liquidate their portfolio at or near the absolute bottom.
Portfolio Glide Path in Financial Models
When we look at Karsten’s table, we are looking at static allocations. The model assumes you pick one specific asset mix like 100% Stocks or 50% Stocks and blindly hold it for 30 to 60 years.
This creates a frustrating financial paradox:
- If you go 100% Stocks: You maximize long-term compounding, but you expose yourself to a catastrophic Sequence of Returns Risk in the first few years of retirement.
- If you go 50% Stocks: You protect yourself against a near-term crash, but over a 50-to-60-year retirement, your success rate plummets because your portfolio lacks the growth engine required to outpace long-term inflation.
But what if you didn’t have to choose a static row? What if your portfolio could adapt dynamically over time? Instead of keeping asset allocation locked, a portfolio glide path dynamically shifts your exposure based on where you are in your retirement timeline. You can pick a more aggressive allocation If you are a 10+ years away from your retirement, and reduce portfolio stock exposure over time as you get closer to the time when you need the money.
Karsten introduces Rising Equity Glide Path (or Bond Tent) in his safe withdrawal rate series. He argues that the investor can enter retirement conservative (e.g., 60/40) to survive Sequence of Returns Risk, and then increase equity exposure (gliding back up to 80% or 100% stocks) inside retirement.
Stock Only vs Custom Portfolio Glide Results
Designing a portfolio glide path is an individual decision based on the investor’s risk tolerance and financial plans. The results will heavily depend on the family’s net worth, future income and expenses, and taxes.
To see how these dynamics play out, we ran a hypothetical scenario through the Nauma platform:
- Family M49 and F48. Live in California. Two kids (11 and 14)
- Net Worth $6M ($2.4M taxable, $1.6M Tax-Deferred, and $490K in tax-free accounts)
- Current Income $720K, Total expenses $254K, taxes $250K
- They currently plan to work for another 8 years
The results are quite interesting. For their retirement fund, the Aggressive portfolio (95% equity, 5% cash) had a 94% success rate when tested in a Monte Carlo simulation, while a Portfolio Glide Path (95% equity → 60% equity for the rest of the plan) had a 93% success rate. This is in line with Karsten’s findings, despite some differences in the market data. Karsten used data from 1871 to 2016, while Nauma uses data from 1992 to the present.
Aggressive Portfolio:
Portfolio Glide Path:
While the overall success rates appear nearly identical, looking under the hood at the distribution of outcomes reveals the true strategic trade-off.
At the overall household level (Module 4) where all financial goals are blended together, the Aggressive portfolio showed better results across all percentiles except p1 and p2. To clarify, the p1 percentile means that among 10,000 Monte Carlo simulation runs, 99% of runs, or 9,900 runs, demonstrated better performance.
The table below illustrates the projected ending value of the entire blended household portfolio across different simulation percentiles:
With this data, the family can now make a significantly more informed decision about whether they want to use a Portfolio Glide Path or stick with an Aggressive, equity-heavy portfolio.
When using the Portfolio Glide Path, the simulation demonstrated greater resilience in worst-case economic scenarios, such as the 2000 Dot-Com bust or the 2008 Financial Crisis, resulting in improved p1 and p2 metrics. The opportunity cost of that downside protection, however, is a roughly 2x lower median portfolio value at the end of their financial plan ($53.1M vs. $106.8M).
How to Configure Portfolio Glide Paths
There are two options for how you can configure your own Portfolio Glide Path in Nauma.
The platform offers planning at both the household and goal levels and provides two ways to create and manage custom portfolio glide paths. If you are working on your financial projection in Module 4, go to Parameters, set Investment Return Calculations to Monte Carlo Simulation, and then select Manage Portfolio Glide Paths in the newly appearing Model Portfolio field.
If you are setting your financial goals in Module 5 and working at the fund level, click the Model Portfolio dropdown and scroll down to Manage Portfolio Glide Paths.
Portfolio Glide Paths are owned by the Financial Projection and shared across Module 4 and Module 5. This means you can reuse a Portfolio Glide Path created in your financial projection later when you start working on your financial goals.
Context Over Cookie-Cutter Advice
Generic financial advice is almost always engineered for the lowest common denominator, pushing conservative allocations because they must work safely for the masses. But high-net-worth tech families often possess unique cash flow structures, equity compensation buffers, and higher personal risk tolerances that make equity-heavy strategies a natural avenue to explore for them.
The main challenge for these families is not knowing their true risk tolerance unless they have already lived through several market cycles and seen how they actually react. Most people know, intellectually, that they should not sell when the market crashes. They answer risk-tolerance questionnaires logically and describe what they would do in a hypothetical downturn. But when a real market crash happens, emotions often take over, and people make very different decisions.
Adding non-correlated assets, such as bonds or managed futures, may reduce portfolio volatility and help investors avoid panic selling. But that benefit comes at a cost.
About the Author: Alex Sukhanov, founder of Nauma, a financial planning platform built for people in tech and high-net-worth families. Alex previously worked at Google and started Nauma to help more people in tech make better financial decisions and achieve more in their lives. You can reach out to Alex on linkedin.
Nauma is supported entirely by its users with no commissions and no affiliate incentives. It is designed to give people clarity on taxes, equity compensation and retirement planning.
Disclaimer: Nauma projections are hypothetical and not guarantees of future results. Tax laws may change, and estimates may not reflect future legislative updates. This content is for educational purposes only and is not tax or investment advice.
u/alex_nauma — 27 days ago
How often do you check your net worth?
A few years ago I barely tracked anything. Now I check my accounts almost every day. Not because I’m spending wildly or trying to time the market. Honestly, I think it became some kind of weird emotional habit after the pandemic, inflation, layoffs, and everything else. Sometimes I open the app while standing in line for coffee. Sometimes right before bed. Sometimes during work meetings I don’t care about. The funny part is nothing usually changes much. But seeing the number somehow makes me feel temporarily more in control of life. Then five minutes later I’m stressed again. I’m curious how normal this actually is among people who care about money and investing.
u/Red_Horse2026 — 1 month ago
▲ 2 r/Nauma
Nauma Blog: Understanding Taxes in Long-Term Financial Projections
One of our users recently reached out with a question: They are working on their financial plan and currently have an approximately $500K+ withdrawal from a taxable account in 2037, but the model estimates $0 in taxes. This unusually low tax made them skeptical and they asked us to look at their financial plan together.
My first thought was that it’s a bug in our tax software unless the user already has or expects to generate significant capital loss carryover which would let them offset their 2037 capital gains and reduce their taxes.
And then we found an interesting insight which we all initially missed.
Current Situation
We started by reviewing their current assets. The total value of their taxable accounts was $1.1M, with a cost basis of $860K.
I normally check whether the cost basis is entered correctly for brokerage accounts before reviewing financial projections. Withdrawals from taxable accounts are generally taxed on the difference between the current value and the cost basis. If the cost basis is missing or entered incorrectly, the model may estimate long-term capital gains taxes incorrectly.
Not entering cost basis is one of the most common mistakes that can affect the model output. While it is technically possible to skip it, I recommend calculating and entering it whenever possible.
Cost basis needs to be entered only when accounts are added manually. Brokerage accounts connected through Plaid have their cost basis calculated automatically by Nauma.
Then we looked at their existing accumulated capital loss carryovers.
In the U.S., if your capital losses exceed your capital gains, you can generally use the excess loss to reduce ordinary income by up to $3,000 per year. Any remaining unused loss is carried forward to future years, where it can be used to reduce future capital gain income and taxes.
Short- and long-term capital losses are tracked separately. They are also tracked separately at the federal and state levels. Due to differences in state taxation, federal and state capital loss carryovers may diverge over time.
To review the current capital loss carryover, I went to Current Income & Expenses in the left menu, scrolled down, and clicked the Tax Settings button. The next page showed that the user did not have any capital loss carryover entered that could impact their future capital gains:
Financial Projection
A financial projection is where mistakes are easy to make, and even small errors can compound over time. That is why it is important to spend time reviewing the data and understanding the assumptions behind the projection.
The user plans to save aggressively over the next 10 years, and their income supports that plan. In Nauma, all unallocated savings are directed to taxable accounts by default, shown as dark green bars. Based on the projection, their total taxable account contributions between 2026 and 2037 are $2.49M.
That increases the cost basis of their taxable accounts from the current $860K to $3.35M in 2037.
The projection uses Monte Carlo simulation to model investment returns. In this case, the user selected the bottom 10th percentile, which is a conservative assumption. It means that 90% of all simulation runs generated higher returns.
Nauma runs these simulations using the selected model portfolio and historical return data from 1992 to the present. Model portfolios are built using stocks represented by VTSMX, bonds represented by VBMFX, and cash represented by 3-month Treasury bills.
Demo account screenshot:
To see the total value of their taxable accounts, we went to the Net Worth tab and clicked the year we wanted to analyze. In this projection, the total value of their taxable accounts is expected to grow to $5.1M in 2037, with a cost basis of $3.35M, as estimated earlier:
When the $500K withdrawal happens in 2037, the model estimates the cost basis of that withdrawal as:
$500K × $3.35M / $5.1M = $328K
That means the realized gain is approximately:
$500K - $328K = $172K
At first glance, that gain appears high enough to create a tax bill. It is higher than today’s standard deduction plus the 0% long-term capital gains bracket:
$32,200 + $98,900 = $131,100
So, should they expect to pay taxes?
In this case, no.
The challenge with estimating income taxes in long-term financial projections is that the IRS adjusts tax brackets and the standard deduction for inflation every year. A $131.1K threshold today would be equivalent to approximately $181.4K in 2037, assuming 3% annual inflation.
As a result, the user’s estimated $172K realized gain is fully covered by the inflation-adjusted standard deduction and 0% long-term capital gains bracket in 2037.
Takeaway
The model applied inflation-adjustment logic to estimate the potential capital gains tax. However, it did not clearly communicate that logic to the user, which made the result feel suspicious.
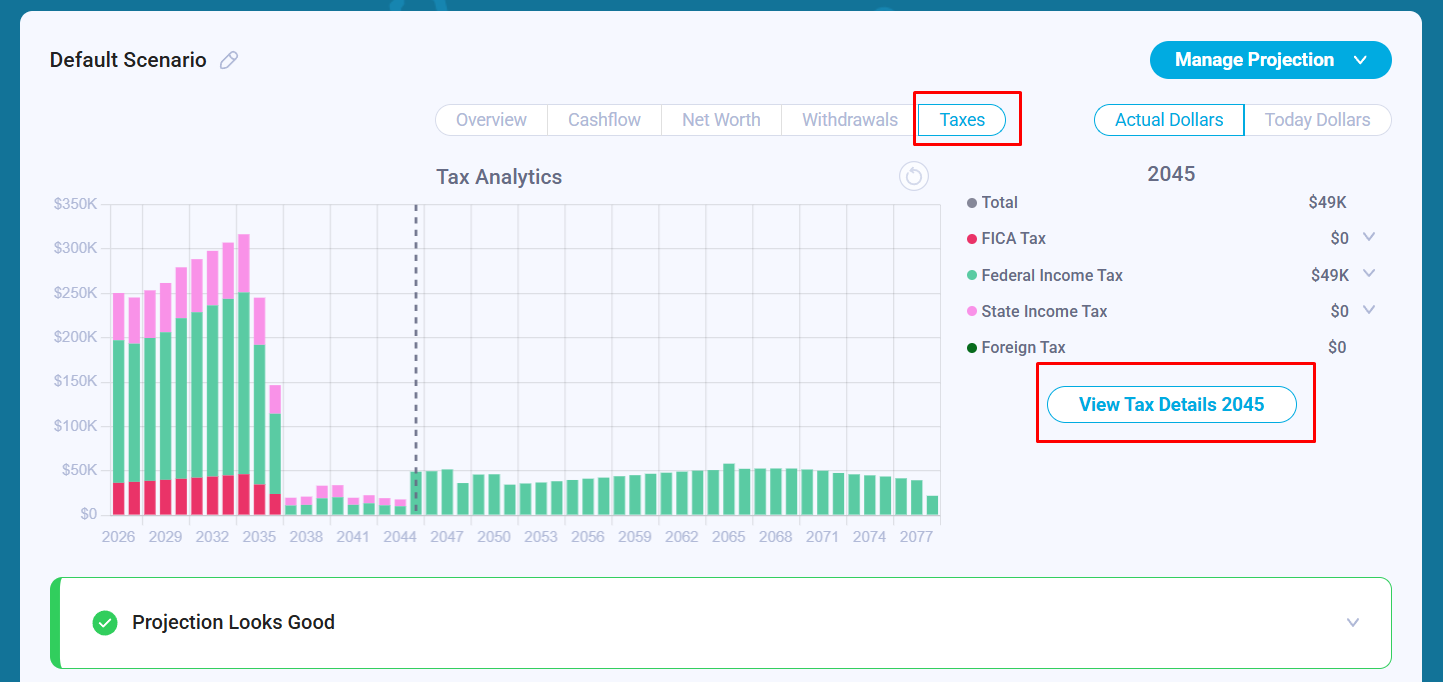
To address this, we added a Tax Details button to help users review the assumptions behind the calculations and verify the results. To get there, click the Taxes tab and then the View Tax Details button.
The button opens a new screen within a projection with a Sankey diagram. The diagram breaks down income taxes by category:
- FICA Tax
- Federal Tax
- State Tax
- Foreign Tax (if enabled)
For each tax category, it shows how much of each tax bracket is filled and how much tax is paid within that bracket in that specific year.
To make the assumptions easier to review, we also added tables below the Sankey diagram showing the standard deduction and the actual tax bracket ranges used by the model for that year.
Ordinary income and long-term capital gains tax brackets are shown separately because they follow different tax rules and thresholds. This makes it easier to understand how the model calculates taxable income, applies deductions, fills each bracket, and estimates the resulting tax liability.
The same view is also available for state taxes.
Visualize Your Own Future
If you have been looking at your own projections and wondering whether the results are correct, you can now dive into the new Sankey diagrams and tax bracket tables in your Nauma account. Whether the model shows a $0 tax bill or a significant liability, you now have the tools to see exactly why those numbers exist.
u/alex_nauma — 1 month ago