Image 1 — How I managed TXN CSPs in a choppy market
Image 2 — How I managed TXN CSPs in a choppy market

How I managed TXN CSPs in a choppy market

TLDR: Market regime is choppy causing my TXN CSP to be ITM several times so I rolled out, sometimes down and out 6 times in total to prevent assignment until it finally expired worthless. $1,185.30 collected, 4.5% ROC. Portfolio is up 18.88% YTD with a 9% max drawdown and up 44% since starting the wheel last June on that same max drawdown.

On 8/11, I sold one TXN $275 CSP expiring that same week for $1.38 after fees. By Thursday's close, TXN was at $273.43, well below my strike, with one day left.

I could have taken the shares and started selling CCs. That's what I did plenty of times last year when the market was healthier. Get assigned, sell calls, eventually get called away, etc. Nothing wrong with that, I actually prefer it that way during strong bull markets but this year's regime is different. I don't feel comfortable holding onto anything for too long during this market.

So I rolled TXN. Six different times

What the rolls looked like

Each roll meant buying back the put I had sold (for more than what I collected in premium) and selling another one with a later expiration. If I could lower the strike and still get a net credit, great. If not, I kept the strike and got paid to wait one more week. I looked for pops when expiration was getting close, but I wasn't going to push the new expiration a month out just to show a credit. Why? Chop.

Here is the whole chain. The cash column is the opening credit or the net credit from that day's roll, after recorded fees. TXN and SPY prices are that day's closes, not the stock prices at my option fills. SPY is just here so you can get an overall feel of what the market was during that time.

Date Put after the trade Net cash that day TXN close SPY close
Aug 11 Sold 8/14 $275 +$137.96 $281.24 $770.56
Aug 13 Rolled to 8/21 $270 +$180.91 $273.43 $777.88
Aug 18 Rolled to 8/28 $267.50 +$156.05 $272.24 $767.45
Aug 27 Rolled to 9/4 $265 +$159.61 $266.54 $771.10
Sep 2 Rolled to 9/11 $265 +$150.96 $254.80 $765.16
Sep 9 Rolled to 9/18 $265 +$251.90 $261.59 $762.40
Sep 16 Rolled to 9/25 $262.50 +$147.91 $260.67 $754.05
Sep 25 $262.50 put expired worthless $0.00 $278.07 $771.35

That was four moves to a lower strike and two weeks where I stayed at $265. Every new expiration was just one week beyond the old one.

The market wasn't making it easy. SPY closed at $777.88 on August 13 and $754.05 on September 16. TXN itself went from $281.24 when I opened the trade to $254.80 on September 2. That September 2 close was $10.20 below my $265 strike, with the September 4 expiration right around the corner. Even on September 16, TXN finished below the $265 strike I was buying back.

The rolls in more detail

On September 2, I paid $921 to buy back the September 4 $265 put. That old put closed at a $349.74 loss on its own. Then I sold the September 11 $265 put for $1,073. The two transactions together brought in $150.96 more cash.

I still had a short $265 put, and TXN was still below $265. If it kept falling, I'd have to manage it again or be prepared for assignment. Going out one week bought me time, not safety.

I made the same-strike move again on September 9 for a $251.90 net credit. On September 16, I finally got the strike down to $262.50 for another $147.91. TXN recovered enough to close at $278.07 on September 25, so the last put expired worthless and I never took the shares.

Across the original put and six rolls, the chain finished at $1,185.30 after recorded fees. That's 4.31% of the original $27,500 collateral over the August 11 to September 25 run.

I'm super happy with this one. I lowered the purchase obligation from $275 to $262.50, kept the next expiration close, collected a credit on every roll and avoided assignment. For what I wanted out of a CSP in this market, that's about as clean as it gets.

It still could have gone the other way. Rolling doesn't make an ITM put disappear, and assignment can happen before expiration too. If TXN had kept sliding, I'd still have been on the hook to buy 100 shares at my latest strike or pay to close the put. In a healthier bull market, I'd probably be more willing to own the shares and sell covered calls. In this regime, I'd rather play defense and keep that choice open.

My YTD and overall performance

Here's a quick summary of my wheel portfolio's year-to-date performance. It's up $14,781.17, or 18.88% on my average deployed weekly capital of $78,275. Most importantly to me, max drawdown is still in the single digits at -9.92%, with a 1.38 Sharpe ratio.

Since launching the wheel strategy in late June 2025, this portfolio is up 44%, with the same -9.9% max drawdown over that entire period. I finished the week with $114,219.64 in cash, or about 75% of this portfolio's capital. 316 trades in total during this period with a 10.7% CSP assignment rate. 4.9 average days in a trade, and $86.42 expectancy per trade.

I spend about 0-3 hours total per week on trading, on average. This wheel portfolio is only a small slice of my overall market capital. I also buy and hold mega-cap stocks/ETFs and run other strategies, including swing trading leveraged ETFs. The YTD figures and snapshot here cover the wheel portfolio only, not those other investments.
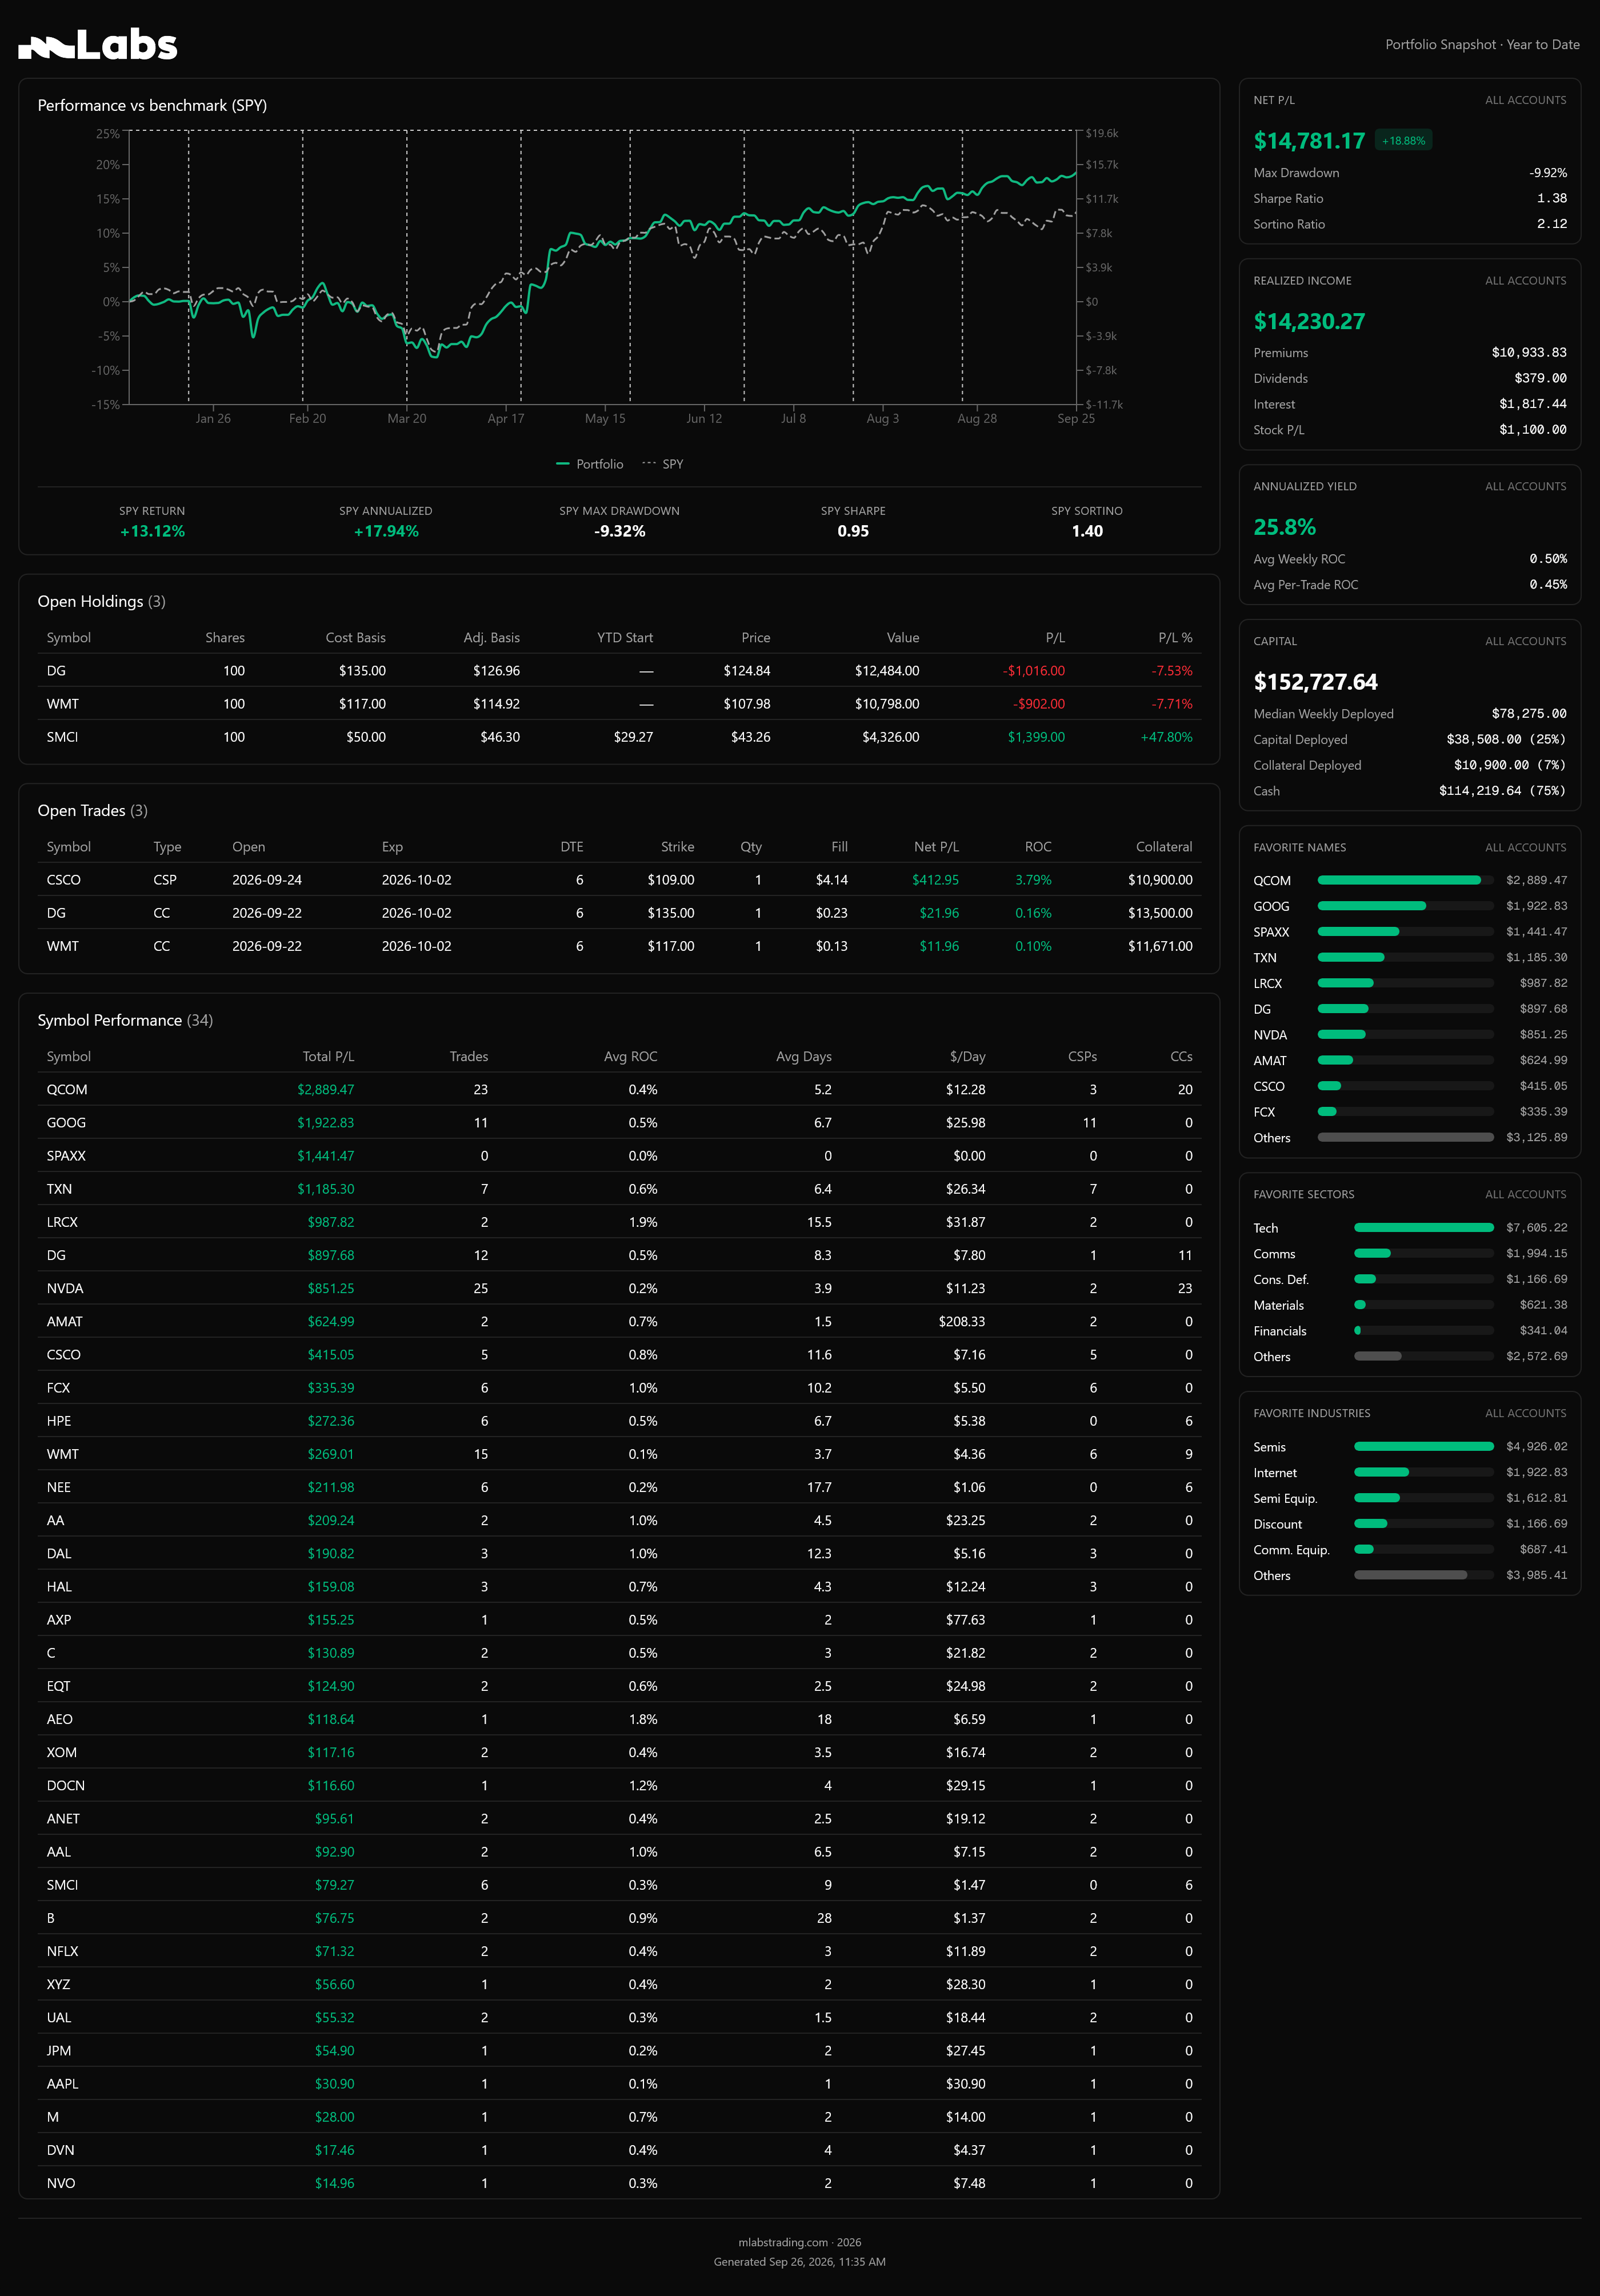
Portfolio snapshot through September 25, 2026

Full YTD trade log (CSV) | YTD cash log (CSV)

u/GarbageTimePro — 18 days ago

How I managed TXN CSPs in a choppy market

TLDR: Market regime is choppy causing my TXN CSP to be ITM several times so I rolled out, sometimes down and out 6 times in total to prevent assignment until it finally expired worthless. $1,185.30 collected, 4.5% ROC. Portfolio is up 18.88% YTD with a 9% max drawdown and up 44% since starting the wheel last June on that same max drawdown.


On 8/11, I sold one TXN $275 CSP expiring that same week for $1.38 after fees. By Thursday's close, TXN was at $273.43, well below my strike, with one day left.

I could have taken the shares and started selling CCs. That's what I did plenty of times last year when the market was healthier. Get assigned, sell calls, eventually get called away, etc. Nothing wrong with that, I actually prefer it that way during strong bull markets but this year's regime is different. I don't feel comfortable holding onto anything for too long during this market.

So I rolled TXN. Six different times

What the rolls looked like

Each roll meant buying back the put I had sold (for more than what I collected in premium) and selling another one with a later expiration. If I could lower the strike and still get a net credit, great. If not, I kept the strike and got paid to wait one more week. I looked for pops when expiration was getting close, but I wasn't going to push the new expiration a month out just to show a credit. Why? Chop.

Here is the whole chain. The cash column is the opening credit or the net credit from that day's roll, after recorded fees. TXN and SPY prices are that day's closes, not the stock prices at my option fills. SPY is just here so you can get an overall feel of what the market was during that time.

Date Put after the trade Net cash that day TXN close SPY close
Aug 11 Sold 8/14 $275 +$137.96 $281.24 $770.56
Aug 13 Rolled to 8/21 $270 +$180.91 $273.43 $777.88
Aug 18 Rolled to 8/28 $267.50 +$156.05 $272.24 $767.45
Aug 27 Rolled to 9/4 $265 +$159.61 $266.54 $771.10
Sep 2 Rolled to 9/11 $265 +$150.96 $254.80 $765.16
Sep 9 Rolled to 9/18 $265 +$251.90 $261.59 $762.40
Sep 16 Rolled to 9/25 $262.50 +$147.91 $260.67 $754.05
Sep 25 $262.50 put expired worthless $0.00 $278.07 $771.35

That was four moves to a lower strike and two weeks where I stayed at $265. Every new expiration was just one week beyond the old one.

The market wasn't making it easy. SPY closed at $777.88 on August 13 and $754.05 on September 16. TXN itself went from $281.24 when I opened the trade to $254.80 on September 2. That September 2 close was $10.20 below my $265 strike, with the September 4 expiration right around the corner. Even on September 16, TXN finished below the $265 strike I was buying back.

The rolls in more detail

On September 2, I paid $921 to buy back the September 4 $265 put. That old put closed at a $349.74 loss on its own. Then I sold the September 11 $265 put for $1,073. The two transactions together brought in $150.96 more cash.

I still had a short $265 put, and TXN was still below $265. If it kept falling, I'd have to manage it again or be prepared for assignment. Going out one week bought me time, not safety.

I made the same-strike move again on September 9 for a $251.90 net credit. On September 16, I finally got the strike down to $262.50 for another $147.91. TXN recovered enough to close at $278.07 on September 25, so the last put expired worthless and I never took the shares.

Across the original put and six rolls, the chain finished at $1,185.30 after recorded fees. That's 4.31% of the original $27,500 collateral over the August 11 to September 25 run.

I'm super happy with this one. I lowered the purchase obligation from $275 to $262.50, kept the next expiration close, collected a credit on every roll and avoided assignment. For what I wanted out of a CSP in this market, that's about as clean as it gets.

It still could have gone the other way. Rolling doesn't make an ITM put disappear, and assignment can happen before expiration too. If TXN had kept sliding, I'd still have been on the hook to buy 100 shares at my latest strike or pay to close the put. In a healthier bull market, I'd probably be more willing to own the shares and sell covered calls. In this regime, I'd rather play defense and keep that choice open.

My YTD and overall performance

Here's a quick summary of my wheel portfolio's year-to-date performance. It's up $14,781.17, or 18.88% on my average deployed weekly capital of $78,275. Most importantly to me, max drawdown is still in the single digits at -9.92%, with a 1.38 Sharpe ratio.

Since launching the wheel strategy in late June 2025, this portfolio is up 44%, with the same -9.9% max drawdown over that entire period. I finished the week with $114,219.64 in cash, or about 75% of this portfolio's capital. 316 trades in total during this period with a 10.7% CSP assignment rate. 4.9 average days in a trade, and $86.42 expectancy per trade.

I spend about 0-3 hours total per week on trading, on average. This wheel portfolio is only a small slice of my overall market capital. I also buy and hold mega-cap stocks/ETFs and run other strategies, including swing trading leveraged ETFs. The YTD figures and snapshot here cover the wheel portfolio only, not those other investments.

Portfolio snapshot through September 25, 2026

Full YTD trade log (CSV) | YTD cash log (CSV)

u/GarbageTimePro — 18 days ago

Why make the options contract bid/ask spread so hard to see?

The UX decision making over at TV is sometimes so braindead.

The indivdual spread column ib the options chain view was good. You've now decided to integrate it into the bid/ask columns and make the text tiny.

Terrible UX change. For the love of god, please bring back the individual spread column!

reddit.com
u/GarbageTimePro — 2 months ago
▲ 487 r/thetagang+2 crossposts

One Year Wheeling BORING Names. The FULL Breakdown

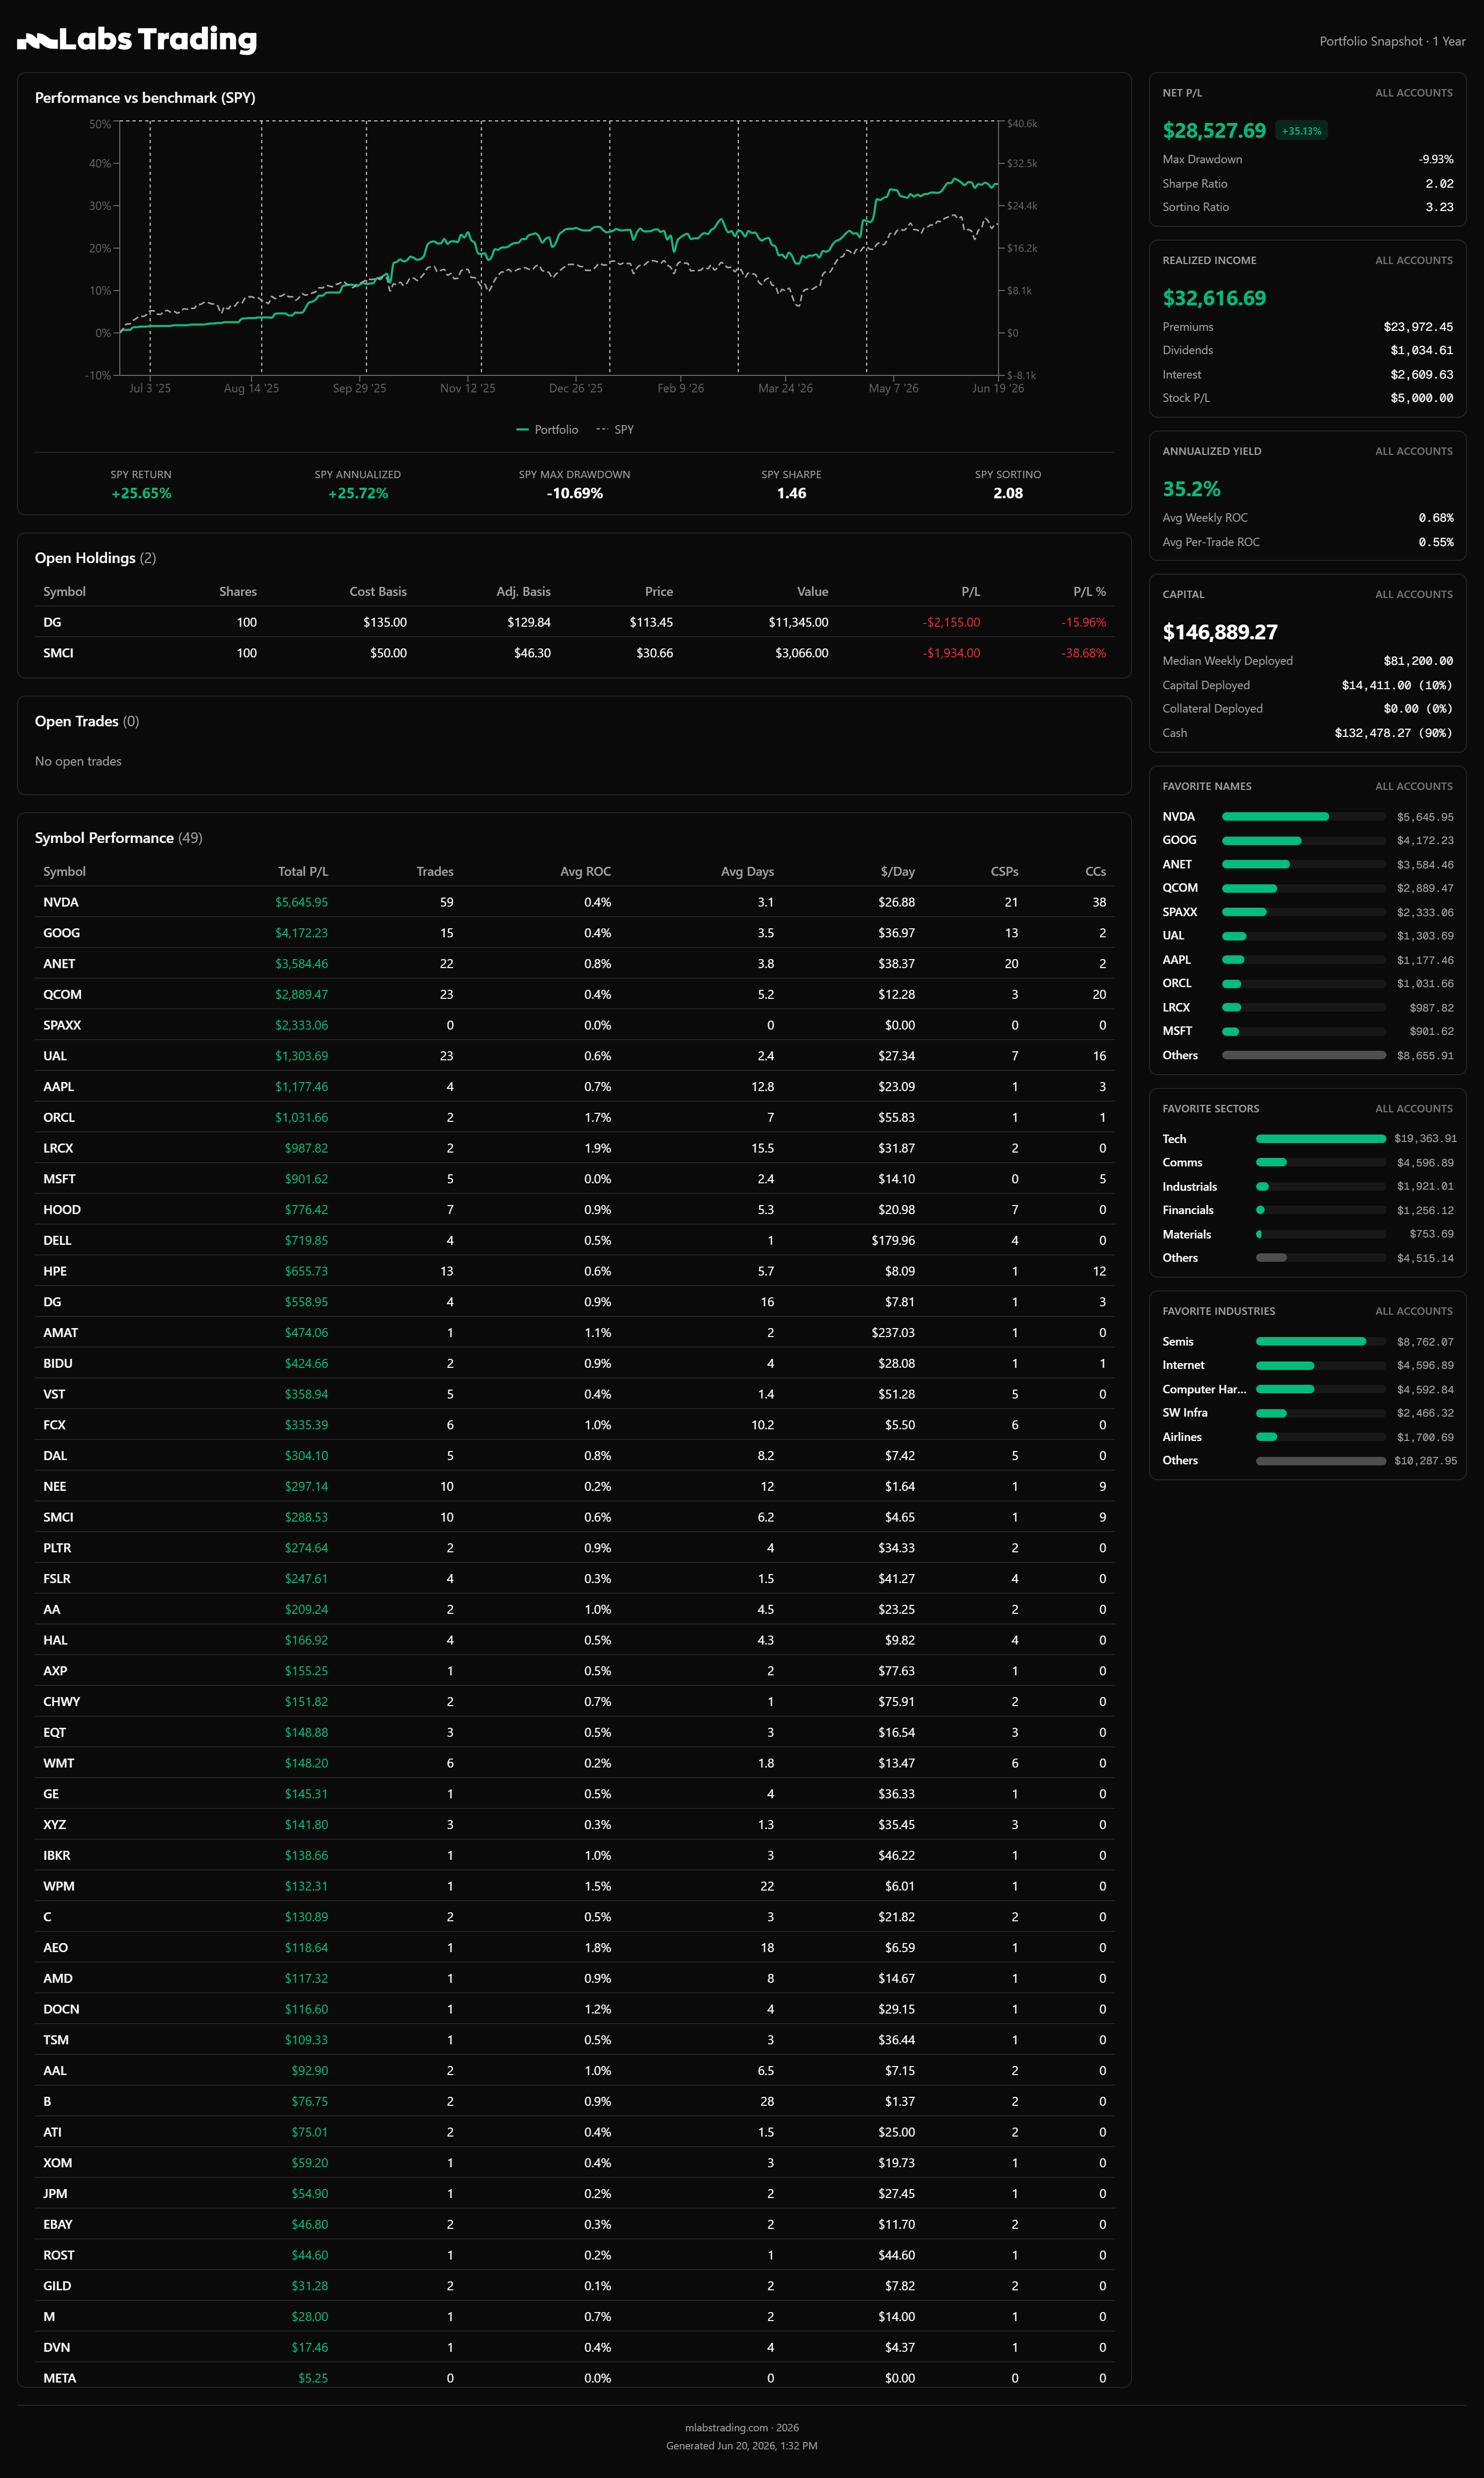
One year ago, on June 16, 2025, I sold the first cash-secured put under what became the weekly "BORING CSPs" which a lot of you saw get posted here regularly. Twelve months and 273 trades later, the account is up $28,527 in net P/L, or +35.13% on the capital I actually put to work. SPY returned +25.65% over the same stretch. I did it with a max drawdown of -9.93%, and on a typical week only about half the account was ever deployed. The rest sat in cash.

That last part is pretty important... I'm not trying to beat the market on raw returns. I'm generating steady income while keeping a big chunk of my money on the sidelines, earning 4%+ in money market, ready to deploy when everyone else is in shambles. When things eventually get ugly, and they always do, I won't be fully invested at the top. Go ask the people chasing fat premiums what their max drawdown looked like this year. Single digits? Probably not.

This post is the full breakdown of one year running the wheel. Every number below comes straight from the trade log, which is downloadable at the bottom if you want to verify any of it.


The Strategy

If you've followed along, you already know the drill. I sell cash-secured puts on boring, profitable companies. I get assigned sometimes. When I do, I sell covered calls and collect premium, dividends, and interest while I wait. That's the entire strategy.

I don't panic over assignments, because when one happens I'm just holding shares of a good business and usually getting paid to sit on them.

The wheel does not have to be complicated. People dress it up with screeners full of greeks and twenty indicators. Strip all of that away and it's still the same three steps. The hard part was never the mechanics. It's picking the right companies and having the patience to do nothing when the regime isn't favorable.


One Year In

Here's the inception-to-date snapshot, June 16, 2025 through June 20, 2026:

Metric Value
Net P/L $28,527.69 (+35.13%)
Realized Income $32,616.69
Premiums $23,972.45
Stock P/L $5,000.00
Interest $2,609.63
Dividends $1,034.61
Total Trades 273
Unique Tickers 47
Win Rate 96.3%
Sharpe Ratio 2.02
Sortino Ratio 3.23
Max Drawdown -9.93%
Annualized Yield 35.2%
Avg Weekly ROC 0.68%
Avg Per-Trade ROC 0.55%
Median Weekly Deployed $81,200
Capital Deployed $14,411 (10%)
Current Cash $132,478 (90%)
Total Capital $146,889
SPY Return +25.65%
SPY Annualized +25.72%
SPY Max Drawdown -10.69%
SPY Sharpe 1.46
SPY Sortino 2.08

The number I care about most is the Sharpe of 2.02 over a full year. That tells you the returns aren't coming from a couple of lucky trades or wild swings. The strategy returned more than SPY (+35.13% on deployed vs +25.65%), with a higher Sharpe (2.02 vs 1.46), a higher Sortino (3.23 vs 2.08), and a shallower drawdown (-9.93% vs -10.69%). That's the definition of having an edge.


The Single-Digit Drawdown

A full year of trading through a war or two, oil spikes, tariff headlines, the QCOM saga, and a brutal semis rout in June, and the worst the account ever drew down was -9.93%. The S&P itself drew down more than that over the same year.

The deepest hole I sat in all year was QCOM. I got assigned at $167.50 and $160, watched it grind down to $124, and stared at roughly $7,900 in unrealized losses before wheeling out with about $2,900 in profit a few months later. I wrote the entire trade up here. It was the hardest stretch of the year and also the best proof the strategy works. I held because the business wasn't trash. The price was down, the company was not. Those are two different things, and knowing the difference is what lets you sit through the red instead of panic-selling the bottom like most retail traders.


Never Oversize a Single Name

The reason a name like QCOM could fall that hard and the account still only drew down single digits is sizing. No single position was ever big enough to matter on its own. Even on the busiest weeks the capital was spread across a handful of names, never piled into one. QCOM was painful, but it was one modest slice of the entire portfolio, never a make-or-break bet.

The same applies to sectors and industries. A wheel account stuffed full of semis or high-beta tech might look diversified by ticker, but it's not diversified by risk. When that group rolls over, every position rolls over together. So I spread across sectors instead of stacking one theme.

And past individual positions entirely, I keep a big cash position. On a typical week only about half the account was deployed, the rest sitting in money market earning interest, which added up to $3,643 over the year just for waiting. Right now I'm at 90% cash with no open trades. That cushion is what lets me sit tight when a position moves against me and add when everyone else is getting forced out.


What I Traded

Here are the top names by P/L over the year. The majority of these aren't speculative, and didn't generate exciting premium:

Ticker Net P/L Trades
NVDA $5,645.95 59
GOOG $4,172.23 15
ANET $3,584.46 22
QCOM $2,889.47 23
UAL $1,303.69 23
AAPL $1,177.46 4
ORCL $1,031.66 2
LRCX $987.82 2
MSFT $901.62 5
HOOD $776.42 7
DELL $719.85 4
HPE $655.73 13

NVDA was the workhorse, mostly covered call management on assigned shares plus a steady stream of puts. QCOM did most of its damage during the wheel that finally completed in late April, when it ripped through my strikes and got called away above cost on both lots after months of grinding. GOOG, ANET, LRCX, ORCL, and the rest are the same kind of name. Companies that recover when they dip and pay you while you wait. There's no SOFI, no HIMS, no MARA, IONQ, TSLL, etc on this list. That's on purpose.


When I Didn't Trade

Look at the activity by month. The trade count tells the discipline story better than anything I could write:

Month Trades Premium
Jun 2025 (from 6/16) 4 $1,189
Jul 2025 5 $589
Aug 2025 13 $1,630
Sep 2025 39 $4,470
Oct 2025 39 $4,958
Nov 2025 29 $1,938
Dec 2025 33 $1,493
Jan 2026 43 $2,099
Feb 2026 13 $1,575
Mar 2026 27 $489
Apr 2026 13 $1,046
May 2026 10 $1,526
Jun 2026 (through 6/16) 5 $1,037

September, October, and January were busy because the market was cooperating and there was real premium to sell. February, May, and June I pulled way back and did almost nothing, sometimes a handful of trades in an entire month. When breadth is bad or premium is not worth the risk, I sit on my hands. The hardest part of selling premium (or trading in general) isn't picking the strike. It's knowing when not to sell (or trade) at all, and being fine watching weeks go by with the account mostly in cash.


Why Boring Works (For me)

Every week I see someone ask what to sell puts on, and the top answers are always whatever X and the theta-based subs are pumping... Usually the premium juicers - SOFI, HIMS, MARA, RIOT, IONQ, etc take your pick. Those names throw off fat premium, but the premium is fat for a reason. The market is telling you the thing could move 15% in a day, 20%+ in a week, and when it does you're stuck holding shares of a company that might not even be profitable.

The people wheeling high-beta junk collected big premium in January and then spent the next several months bagholding through 30 to 40% drawdowns on names that don't bounce back the way a BORING mega cap name does. Meanwhile my trade log is full of companies that recover, pay dividends while you wait, and let the wheel actually do its job because the business isn't broken when the stock is down.

It's boring on purpose. Boring is what helped keep my drawdowns in single digits.


Where Things Stand

As of June 20, one year in:

  • $28,527 net P/L (+35.13% on deployed capital)
  • 2 holdings: 100 shares DG, 100 shares SMCI, both currently red and both being held
  • 0 open trades
  • $132,478 cash across all accounts (90% of capital)
  • $146,889 total capital
  • $81,200 median weekly deployed

DG and SMCI are both underwater right now, and that's fine. They're being wheeled the same way QCOM was, with covered calls and patience, and I'll keep grinding the cost basis down until they come back. That's the strategy working exactly as designed, not breaking.

One-year portfolio snapshot since inception, June 16 2025 through June 20 2026


Addressing the "you could have just bought and held SPY" crowd

Before the comments fill up with it, let me get ahead of the obvious one. I posted a similar breakdown a few weeks back and a good chunk of the feedback was some version of "all that effort to barely beat SPY" (that thread here). It's somewhat of a fair point, so I'll take it head on instead of pretending it isn't there.

First, the context that matters most: this account is dedicated to the wheel and nothing else. It is a small portion of my overall capital in the markets. The bulk of my money sits in separate buy-and-hold portfolios, index funds, and mutual funds that are completely unrelated to this strategy. This was never wheel-or-SPY with my entire net worth. The wheel is one defined-risk bucket doing one job, and I hold plenty of long-only index exposure elsewhere.

Now for everyone still sure buy-and-hold was the obvious move, a few honest questions:

1. Before this period started, would you have confidently put 100% of the same capital into SPY and held it the whole time?

2. Are you judging the strategy based on what was knowable at the time, or based on the best-looking outcome after the fact?

3. If SPY had gone flat or dropped 10-15%, would you still be saying buy-and-hold was obviously the better choice?

4. If the critique is "you could have bought SPY," where was that call at the beginning of the year, before the outcome was known? I can't seem to find those posts/comments in theta-based subs.

5. What are your returns YTD, 1Y, and max drawdown during those periods?


Final Thoughts

The wheel is not going to make you 100% in a year. That was never the goal. But if you pick the right companies, size your positions so no single one can hurt you, and have the patience to sit through drawdowns and dead weeks, it does exactly what it's supposed to. A full year in, I'm up +35.13% on deployed capital, ahead of SPY, with a max drawdown under 10% and, on average, close to half the account in cash.

That's the case for boring. Better risk-adjusted returns, a shallower drawdown than the index, and a strategy simple enough to run for the rest of your life. Year two starts the same way year one did. One boring put at a time.

Download Full Trade Log (CSV)


My stack

I have about 30 different jobs running throughout the day inside of my homelab (r/homelab) pulling and processing stocks, options, news, sentiment, fundamentals, and technicals data. Ive been building this over the years and it started as a hackathon project at work 3 years ago (yep, before vibe coding). This pipeline does maybe 95% of the heavy lifting. By 8:05pm eastern, the data for the next day is ready for me to do a quick manual verification pass for the CSP candidates going into the next day. I also built a thin inference layer to do a small portion of the analysis. This inference layer lives in my homelab as well running an open source model (qwen variants) on a RTX3090 - shoutout to those over at r/LocalLLM/.

Here's an actual picture of my homelab: https://www.reddit.com/r/homelab/comments/1ru0xc5/my_homelab_for_now/


UPDATE as of 10:52am EST: I'm about to play a round of golf w/ my father - will get back to all of the comments after the round. Happy fathers day to the dads out there!

u/GarbageTimePro — 4 months ago
▲ 34 r/CashSecuredPuts+2 crossposts

+11.17% Wheeling BORING Names YTD. Here Are the Details.

I’m back for another weekly post part of my BORING CSPs series that I’ve been running and publicly logging weekly since Spring 2025, using real capital and real risk. I appreciate everyone who’s been following along!

If you just care about numbers, and want to move on, I'm sitting at +11.17% YTD with a max drawdown of 9.92% deploying an average of $82.5k a week. Since inception (11 months), I'm sitting at +35.33% with that same max drawdown. A more detailed YTD snapshot is attached at the end of the post...


I'm up 11.17% on deployed capital, $9,073 in net P/L on a $147K account. My median weekly deployed capital is only $81,200. 1/2 of my money has been sitting in cash earning 4%+ in money market.

I'm not trying to beat the market on raw returns. I'm generating consistent income while keeping a big chunk of my money on the sidelines, ready to deploy when everyone is in shambles. And when things eventually do get ugly (they always do), I won't be fully invested at the top. Do yourself a favor and ask those who chase juicy premiums what their max drawdown was this year. 30%? 45%? Higher?

This post is a full breakdown of the YTD performance of the BORING PUTS strategy through May 31, 2026. Every trade, every number, every ticker. The full trade log is downloadable at the bottom if you want to verify anything.


The Strategy

If you've been following me for a while, you already know... but if not, I just sell CSP's on boring, profitable companies. Get assigned sometimes. Sell covered calls when you do. Sometimes collect premium and dividends while you wait. That's it.

No 0 DTE /r/wallstreetbets highlights, no meme's, no 3x leveraged ETF's, no fat premium juicers. Just large-cap names with ER beats, strong balance sheets, and liquid options chains. I don't stress assignments because when those happen, I'm just holding shares of a good business and sometimes getting paid to wait.


YTD 2026

Metric Value
Net P/L $9,073.50 (+11.17%)
Realized Income $8,451.20
Premiums $6,100.88
Stock P/L $1,100.00
Interest $955.32
Dividends $295.00
Trades 106
Sharpe Ratio 1.26
Sortino Ratio 1.94
Max Drawdown -9.92%
Annualized Yield 27.6%
Avg Weekly ROC 0.53%
Avg Per-Trade ROC 0.46%
Median Weekly Deployed $81,200
Capital Deployed $41,670 (28%)
Current Cash $105,379 (72%)
Total Capital $147,049
SPY Return +10.93%
SPY Annualized +26.96%
SPY Max Drawdown -9.32%

The +11.17% return is on median deployed capital of $81,200 plus dividends & interest, not on the full $147K account.

When the market was in shambles (Hormuz, TACO, etc.), I wasn't sweating a fully invested portfolio. I was sitting in a decent amount of cash earning 4%+ in money market while waiting.

The max drawdown of -9.92% happened during the QCOM saga. I got assigned at $167.50 and $160, watched it drop to $124, and sat through $7,900 in unrealized losses before eventually wheeling out with $2,900 in profit. Wrote a full breakdown of that trade on my blog and in several subs. That was the hardest stretch so far, but it's also the best proof of concept. The wheel works if you trust the business and stay patient.


What I'm Trading

Look at the YTD ticker list. These aren't speculative names and they won't offer juicy premiums:

YTD Top Symbols by P/L:

Ticker Net P/L
QCOM $2,889
LRCX $988
NVDA $791
GOOG $654
DG $559
HPE $272
NEE $212
AA $209
DAL $191

QCOM was the biggest YTD earner at $2,889. Most of that came from the full wheel completing itself. I was underwater for months, grinding CC premium week after week, sometimes earning pennies, collecting dividends, and in late April it finally ripped through my strikes and I got called away above cost on both lots. A long, boring grind that paid off. RIP to those selling CC's under their cost basis. That's the risk you take when doing that.

LRCX has been the other standout at $988. The first trade I bought back next day for a quick $225. The second is a $260 put still open, sitting at +$763 in premium.

NVDA is at $791 YTD. A lot of that was CC management on assigned shares. Some of those individual CC trades had to be rolled (after the stock ripped), but the net across all NVDA activity this year is still solidly positive.


Why Boring Works

I see posts every week from people asking "what should I sell puts on?" and the top answers are always stuff like SOFI, HIMS, MARA, RIOT, IONQ, or whatever WSB and X is pumping that week.

Those names offer fat premiums. But the premium is fat for a reason. The market is telling you this thing could move 15% in either direction next week. And when it does, you're stuck with shares of a company that might not even be profitable, trading at 200x revenue, with a questionable balance sheet.

The people wheeling high-beta junk collected fat premium in January and then spent the next four months bagholding through a 30-40% drawdown (or buying back at a large loss) on names that don't recover the way a QCOM or NVDA does.

Meanwhile I'm sitting here with QCOM, NVDA, GOOG, WMT, XOM on my trade log. Companies that recover. Companies that pay dividends (except NVDA's measly $0.01) while you wait. Companies where the wheel actually works because the business isn't broken when the stock is down.


When I Don't Trade

This might be the most important part of the whole strategy. There were multiple stretches this year where I did almost nothing. Zero new positions. Just sat on my hands and waited.

When breadth is bad, I don't open new risk. The hardest part of selling premium isn't picking the right strike. It's knowing when to not sell at all.

Look at the monthly trade counts YTD:

Month Trades Net P/L
January 43 $2,099
February 13 $1,575
March 27 $489
April 13 $1,046
May 10 $1,526

January was busy, the market was cooperating and I was actively managing QCOM and NVDA positions. February I pulled way back to 13 trades. March had 27 trades but most were small CC management on existing positions, grinding $20-$50 per round. April, 13 trades again. May, only 10 trades in the entire month.


Where Things Stand Now

As of May 31:

  • $9,074 net P/L YTD (+11.17% on deployed capital)
  • 2 holdings: 100 shares DG, 100 shares SMCI
  • 2 open trades: LRCX 6/5 $260 CSP, SMCI 6/5 $60 CC
  • $105,379 cash across all accounts (72% of capital)
  • $147,049 total capital
  • $81,200 median weekly deployed

YTD portfolio snapshot through May 30, 2026


The Bigger Picture: 11 Months In

For context, this strategy has been running since June 16, 2025. Here's the inception-to-date snapshot:

Metric Value
Net P/L $28,687.39 (+35.33%)
Realized Income $30,798.76
Premiums $22,216.39
Stock P/L $5,000.00
Interest $2,547.76
Dividends $1,034.61
Total Trades 268
Unique Tickers 45
Sharpe Ratio 2.13
Sortino Ratio 3.41
Max Drawdown -9.93%
Annualized Yield 37.2%
Avg Weekly ROC 0.71%
Avg Per-Trade ROC 0.54%
SPY Return (same period) +25.52%
SPY Annualized +26.84%
SPY Max Drawdown -10.54%
SPY Sharpe 1.64
SPY Sortino 2.40

A Sharpe above 2 over 11 months is the number I care about the most. It means the returns aren't coming from wild swings or getting lucky on a couple huge trades. It's consistent, boring, repeatable income.

Inception-to-date portfolio snapshot (~11 months)


STAY BORING my friends!

Download Full Trade Log (CSV)


UPDATE: Lots of critical feedback about barely beating SPY 5 months into the year which is somewhat of a fair point. My questions to those who share the same thought:

1. Before this period started, would you have confidently put 100% of the same capital into SPY and held it the whole time?

2. Are you judging the strategy based on what was knowable at the time, or based on the best-looking outcome after the fact?

3. If SPY had gone flat or dropped 10–15%, would you still be saying buy-and-hold was obviously the better choice?

4. Would you rather see transparent updates when the strategy is only even with SPY, or only see posts after someone has huge gains?

5. If the critique is "you could have bought SPY," where was that call at the beginning of the period, before the outcome was known?

6. What are your returns YTD, 1Y, and max drawdown during those periods?

u/GarbageTimePro — 5 days ago

Game crashing when going from Practice -> Qualify or Practice -> Race

I have an annoying issue where the game transitions from Practice to Qualify or Practice to Race the game suddenly crashes, all monitors go on standby, GPU fans are on max, and I have to force reboot the computer. The audio is still running while the PC crashes though.

I have a top tier PC and the game runs great whenever I'm in a race so it's not an overheating issue. This only happens on iRacing, no other game. I saw a few threads on here and on the iRacing forums but there doesn't seem to be a fix so I just wanted to bring this up, yet again…

My Windows event logs are showing LiveKernelEvent 1b8 and 141 error codes

reddit.com
u/GarbageTimePro — 5 months ago

Recap: Trade log for the week of May 4

Recap: Trade log for the week of May 4

The rally accelerated into the first full week of May. The S&P moved from 7,230 to 7,399, the Nasdaq surged from 25,114 to 26,247, and VIX held steady near 17.2. Oil was the outlier, dropping from $102 to $95 as demand concerns crept back in. Tech and semis drove the gains, keeping the tape risk-on but increasingly stretched.

We opened four positions across the week. Monday we filled the NVDA 5/8 $192.50 CSP and the LRCX 5/15 $235 CSP. LRCX moved in our favor quickly, so we bought it back Tuesday for a net $225 gain after one day, then re-entered Wednesday with the LRCX 6/5 $260 CSP at a higher strike and longer duration. Wednesday we also wrote the SMCI 5/15 $50 CC against our existing shares to collect premium on a position that is still underwater. The NVDA CSP expired worthless Friday.

Both carryover covered calls from the prior week expired via assignment Friday. NVDA got called away at $190 on a $192.50 cost basis, a $2.50 per share stock loss that the CC premium more than covers. QCOM got called away at $170 on a $160 cost basis, locking in a $10 per share stock gain on top of all the CC premiums collected since January. The second QCOM lot ran for 105 days from assignment to call-away, completing the full wheel cycle on both accounts. That closes both positions out entirely.

The portfolio finished the week at +9.48% YTD with $7,693.98 net P/L, max drawdown at -9.92%, and SPY at +8.17% over the same window. Three positions carry into next week: the DAL 5/15 CSP, the SMCI 5/15 CC, and the longer-dated LRCX 6/5 CSP. We will keep selling boring.

Portfolio snapshot as of May 10, 2026


This Week's Totals

Metric Value
ROC 1.24%
Annualized Yield 64.6%
Total Premium $1,139.22
Capital Used $92,000

This Week's Opening Trades

Type Open Exp Close Ticker Strike Qty Fill Exit Fee Cap P/L ROC
CSP 5/4 5/8 5/8 NVDA 192.5 1 0.96 0.00 1.05 19.25k 94.95 0.49%
CSP 5/4 5/15 5/5 LRCX 235 1 3.82 1.55 2.12 23.5k 224.88 0.96%
CC 5/6 5/15 SMCI 50 1 0.57 0.00 0.55 5k 56.45 1.13%
CSP 5/6 6/5 LRCX 260 1 7.64 0.00 1.06 26k 762.94 2.93%

Download Full YTD Trade Log (CSV)


This Week's Assignments

  • 100 shares NVDA (A1) called away at $190 on 5/8 (cost basis $192.50)
  • 100 shares QCOM (A2) called away at $170 on 5/8 (cost basis $160.00)

Open Carryover Positions

Open positions from previous weeks that are counted towards deployed capital. These positions did not generate premiums this week.

  • 1 x DAL 5/15 CSP @ $65

Closed Carryover Positions

Closed positions from previous weeks that are counted towards deployed capital. These positions did not generate premiums this week and may have reduced premiums earned from previous weeks.

  • 1 x NVDA 5/8 CC @ $190 A1 (called away, +$1,434.33)
  • 1 x QCOM 5/8 CC @ $170 A2 (called away, +$1,311.33)

Current Holdings

  • 100 shares DG @ $135.00 (A1)
  • 100 shares SMCI @ $50.00 (A1) - active 5/15 $50 CC

All trades have been immediately posted in the mLabs Trading Discord community upon execution.

Join the mLabs Trading Discord server

u/GarbageTimePro — 5 months ago
▲ 160 r/thetagang+2 crossposts

I’m back for another weekly post part of my BORING CSPs series that I’ve been running and publicly logging weekly since Spring 2025, using real capital and real risk. I appreciate everyone who’s been following along!

If you just care about numbers, and want to move on, I'm sitting at +8.72% YTD with a max drawdown of 9.92% deploying an average of $85k a week. A more detailed YTD snapshot is posted at the end...

This post will be a bit different than my usual BORING CSP's as we've just experienced the worst part of the wheel strategy. The whole "collecting pennies in front of a steamroller". It's real... This post will be long and probably BORING because I break down EVERYTHING that went into my QCOM trade from start to finish:

  • The good: premium collection, dividends, grinding cost basis lower every week.

  • The bad: a 26% drawdown, staring at $7,900 in unrealized losses, months of sitting on your hands while Strait of Hormuz headlines make you question everything.

  • And the best: the eventual recovery and a profitable exit on a stock that got crushed for 3 months straight.

Onto QCOM...

Everyone talks about the wheel strategy like it's free money... Sell CSPs, get assigned, sell CCs, collect premium, repeat. Easy money. Until your mentals are tested when the stock tanks and you are sitting on a massive unrealized loss.

Throw in a war or 3, some TACO headlines, and FURU's showing screenshots of 60% gains overnight and suddenly you're questioning every decision you've made and wondering if you actually know what you're doing - Maybe I should have bought GME 5/8 $25 calls instead..." You might even consider just buying to close at a massive loss to move money elsewhere.

Are you even trusting the wheel strategy or are you just chasing premium and hoping the stock doesn't tank?


Before You Sell the First CSP

I see people on here all the time asking "what should I wheel?" and the answers are always just a list of tickers or the "only sell csp's on names you're willing to hold for a while" line. Which is TRUE, but really... what does that even mean?

Very few people actually talk about the process of deciding whether a name belongs in a wheel portfolio. /u/scottishtrader is one of the few that immediately comes to mind.

So before I get into the QCOM story, here's how I think about it.

Would you hold this through a 30-50% drawdown?

This is the first filter. Not "would I buy the dip if it drops 5%" but would I still believe the business survives and recovers if the chart gets truly ugly for months.

QCOM dropped 26% on me. I held because the business wasn't broken. The price was just down, mostly on cautious forward guidance and Apple potentially replacing QCOM modems with their own. But the fundamentals didn't change. $10B+ per quarter in revenue, dominant in mobile chips, expanding into automotive and IoT. There was no "this company could be irrelevant in 5 years" risk.

There's a massive difference between selling CSPs on QCOM and selling them on high beta/high premium juicers like SOFI, HOOD, HIMS, ONDS, etc. Go ask the people who regularly wheel those how their YTD is going. What about their max drawdowns? Sure they might have some fat premiums but are they actually even close to profitable this year? They're most likely deep in the red right now and bagholding with no clear path out. Those names are way too volatile, the drawdowns are even sharper, and when they drop they can stay down for even longer. That's why I stick to boring instead of chasing premiums.

Balance sheet survival

In a drawdown, the companies that recover are the ones that don't need to issue a ton of stock, cut essential investment, or refinance debt at terrible terms just to stay alive.

Before selling the first CSP I want to see manageable debt, strong cash position, interest coverage that isn't fragile, and free cash flow that covers dividends and debt service. QCOM checks all of those. They only pay out about 30% of their free cash flow as dividends, they buy back billions in stock every year, and they're not going to get blown up by a credit crunch. That matters when you're sitting at -26% and the market is selling everything.

I avoid names where a recession or rate spike could permanently impair the business. If the balance sheet can't survive a bad year, the wheel can turn into a death spiral.

Valuation and entry

A great company can still be a bad wheel entry if you sell puts when it's wildly overpriced. Before the first CSP, I ask: is the strike below a valuation level I actually like? Is my breakeven attractive or am I just staring at annualized yield? If assigned, am I buying at a price where future returns still make sense?

Your real entry price is strike - premium received. The lower that breakeven is relative to fair value, the better your drawdown cushion.

My first QCOM CSP was at the $167.50 strike. After premium, my breakeven was around $166.38. Not exactly deep value, but QCOM at $166 felt reasonable for where the business is headed. The second lot at $160 was even better.

Options liquidity and premium quality

I don't wheel illiquid chains. You want tight bid/ask spreads, good open interest near your strike, and easy exits if the trade moves against you. A boring stock with a dead options chain is annoying to manage.

And high premium isn't automatically good. I see it all the time in this sub and other options related ones - "This week's high premium names blah blah". Sometimes it's high because the market is pricing in real danger. Earnings next week, FDA approval, fraud headline, /r/wallstreetbets squeeze, rumors, etc. That's not the kind of premium I want.

The best premium in my opinion comes from normal IV on a stable large cap, temporary market-wide volatility, or broad sector weakness that doesn't break the company thesis. QCOM had decent IV from the pullback in January without any company-specific landmine. That's the kind of setup I want.

Dividends help. But only if they're sustainable.

A dividend isn't required for the wheel. But it helps when you're assigned and waiting for recovery. You'll see later how QCOM's $0.89/share quarterly dividend chipped away at my cost basis while I was sitting on a big unrealized loss.

But watch out for yield traps. A 9% dividend yield on a stock that's collapsing because the business is deteriorating is not helping you. You want a dividend covered by free cash flow with a reasonable payout ratio. Not a dividend funded by debt on a melting business.

Position sizing

This one is huge and I don't see it talked about enough. These two QCOM lots tied up about $32,750 in capital for me. That's a meaningful position, but it was not my entire portfolio. I was still making moves with the rest of my money. I was still selling CSPs on other names, still collecting premium elsewhere. QCOM being down 26% was painful but manageable compared to the rest of my portfolio.

A wheel portfolio full of semis or all high-beta tech might look diversified by ticker but it's not diversified by risk. Spread it out into other sectors and industries.

Have a plan before assignment, not after

Before the CSP, you should already know: will I sell CCs immediately? At what strike? Above cost basis only, or am I willing to go below? Will I average down or never add? What would make me exit entirely?

If you would panic after assignment, it wasn't a good CSP in the first place.

My plan for QCOM was simple. If assigned, sell CCs at or above my cost basis when premium is decent. If the stock drops hard and CC premium near my cost is garbage, do nothing and wait or start selling CC's below my original cost but near my adjusted cost basis. Don't sell aggressive CCs below cost just to generate income. Many of those who did this with QCOM are regretting it right now - I promise you that. Trust the business and be patient.


The Setup (mid-January)

Like I said above, QCOM was pulling back from the $180 area in early January. It passed my checklist. So I sold CSPs across a couple accounts.

Got assigned fast:

  • Lot 1: 100 shares at $167.50 strike (assigned Jan 15, stock was already at $161)
  • Lot 2: 100 shares at $160.00 strike (assigned Jan 23, stock was at $155)

Also closed one more CSP for a quick ~$67 profit before assignment. Total CSP premium collected across all the QCOM CSPs: about $310.

At this point I'm holding 200 shares. Average cost around $163.75. Stock is trading around $155. Already in the red. It is what it is...


The Grind (late January - early February)

Started selling covered calls immediately on the assigned shares. Struck them mostly around $165-$170 on Lot 1 and $160-$165 on Lot 2. IV was still decent from the pullback so premiums were reasonable.

Through the rest of January I was actively managing CCs. Selling, buying back early when they decayed, re-selling. Nothing fancy. Just grinding.

Between both lots I collected about $650 in CC premium in about two weeks. One trade on Lot 2 was a $160 strike CC I sold for $2.24 and bought back for $0.01 when the stock dropped hard through the strike. That single trade netted $223.

Then February 5 happened. QCOM gapped down from $149 to $133 at the open and closed at $136.

Now I'm holding 200 shares with a ~$163.75 average and the stock is at $136. That's about $5,500 in unrealized losses.

The CCs I had open expired worthless or I bought them back for pennies. Full premium kept. Small consolation.


Doing Nothing (February)

This is the part nobody talks about on here.

QCOM bounced around $137-$145 for the entire month of February. My cost basis was $163-$167.50 depending on the lot. I could have sold CCs at $140-$145 strikes but the premium was trash at those levels and if the stock snapped back I'd be locking in a massive realized loss getting called away 20 points below my cost.

So I did nothing. For a full month. No new CCs. Just held my shares.

This is where most people blow up the wheel. They see the red on the screen and they panic. They either dump the shares for a loss or they sell aggressive CCs at low strikes to "make some of the money back" and then get called away, turning a paper loss into a real one.

I didn't do either because I knew what I owned. QCOM is printing billions in free cash flow. They weren't going bankrupt. The business hadn't changed. The price changed. Those are two different things.

So I sat on my hands and waited.


The Ugly Grind (March - early April)

By March, QCOM started drifting even lower. Hit the $130s. Then the high $120s. It bottomed around $124 on April 7.

My Lot 1 cost basis was $167.50. Stock at $124. That's a 26% drawdown from my cost.

At the absolute low, my unrealized loss across both lots was roughly $7,900.

But I resumed selling CCs in March at lower strikes. $150. $145. $140. The premiums were small. Like $17-$45 per round per lot. That's maybe $25 average per trade. With 200 shares I was pulling in roughly $50-$100 per week.

It's not exciting. No FURU's are posting $25 premium screenshots on Reddit or X. But every dollar chips away at the cost basis. From March to early April I collected another ~$400 in CC premium across both lots. Still grinding.


The Dividend

March 26, QCOM paid its quarterly dividend. $0.89 per share. On 200 shares that's $178.

Another $0.89/share off my cost basis on each lot. This is one of the reasons you wheel dividend-paying companies. You get paid to wait while the stock figures itself out.


The Recovery (mid-to-late April)

Mid-April QCOM starts creeping back up. $128, $131, $133, $136. I stopped selling CCs around April 6. Didn't want to cap the upside right before a potential move. Felt like the selling pressure was exhausting itself.

For about 2.5 weeks I'm just sitting there. No CCs. No premium. Just holding and watching.

Then April 24. QCOM gaps up to $149 from $134 the day before. I immediately sell $170 CCs on both lots.

Then April 30. QCOM gaps up AGAIN. Opens at $172, runs to $187 intraday, closes at $179.

After 3.5 months of grinding, bag-holding, and collecting nickels and dimes, my shares are above my cost basis. Above my CC strikes. Just like that.


The Exit

Lot 1: My $170 CC got assigned on May 1. 100 shares called away at $170. Done. Position closed.

Lot 2: When QCOM blew through $170, I had to manage the CC. Bought it back for a loss, immediately re-sold a new $170 CC expiring the following week for a much fatter premium. Net positive on the roll. With QCOM sitting at $177, this lot is almost certainly getting called away Friday.


The Math

This is the whole point. Here's how premiums and dividends ground down my cost basis over 3.5 months:

Lot 1 (100 shares at $167.50):

Per Share
Original cost basis $167.50
CSP premium -$1.12
CC premium (10 rounds) -$4.56
Dividend -$0.89
Adjusted cost basis $160.93
Called away at $170.00
Profit per share $9.07
Total lot profit ~$907

Lot 2 (100 shares at $160.00):

Per Share
Original cost basis $160.00
CSP premium (2 trades) -$1.98
CC premium (8 rounds + 1 roll) -$7.16
Dividend -$0.89
Adjusted cost basis $149.97
Called away at (projected) $170.00
Profit per share $20.03
Total lot profit ~$2,003

Combined: ~$2,900 in total profit on ~$32,750 in capital over 3.5 months. That's roughly 8.8% return, or about 30% annualized.

On a stock that dropped 25% on me.


The Lesson

At the worst point I was staring at $7,900 in unrealized losses. I had collected about $1,300 in premiums and dividends by then, which softened it, but I was still deep in the hole on paper.

The only reason I held through that was conviction in the business. Not some vague "I like the stock" feeling. Actual fundamental conviction.

That's the real lesson here. For me, the wheel works best when it's BORING. When you're wheeling a company you actually understand, that you've done the work on, that you know is generating real cash flow and isn't going anywhere. The premium collection is secondary. The stock selection is everything.


YTD Performance Snapshot

u/GarbageTimePro — 5 months ago