u/alemorg

1.96 Billion People. 81 Days. Southern Asia's Hormuz Crisis
▲ 76 r/oil

1.96 Billion People. 81 Days. Southern Asia's Hormuz Crisis

May 21, 2026

This is a continuation from my previous post about South East Asia. It’s a big area so I had to split it up in to different parts. It is a long post but you can skip the rest and just read the summary. There is a link for the infographics and the key sources/Glossary. Let me know what you guys think!

https://www.reddit.com/r/oil/s/cmHObVtzLC

TLDR/Summary

February 28, 2026: Iran mines the Strait of Hormuz. Transit collapses ~90-95%. 20% of the world's oil stops moving. Southern Asia, 1.96 billion people, has no workaround.

Brent crude: $111/barrel May 19, fell to ~$106 at close May 20 as peace talks accelerated (TradingEconomics/Yahoo Finance). Middle Eastern crude trades at a premium because the disruption IS in the Gulf. The real cost to these countries is above the Brent headline.

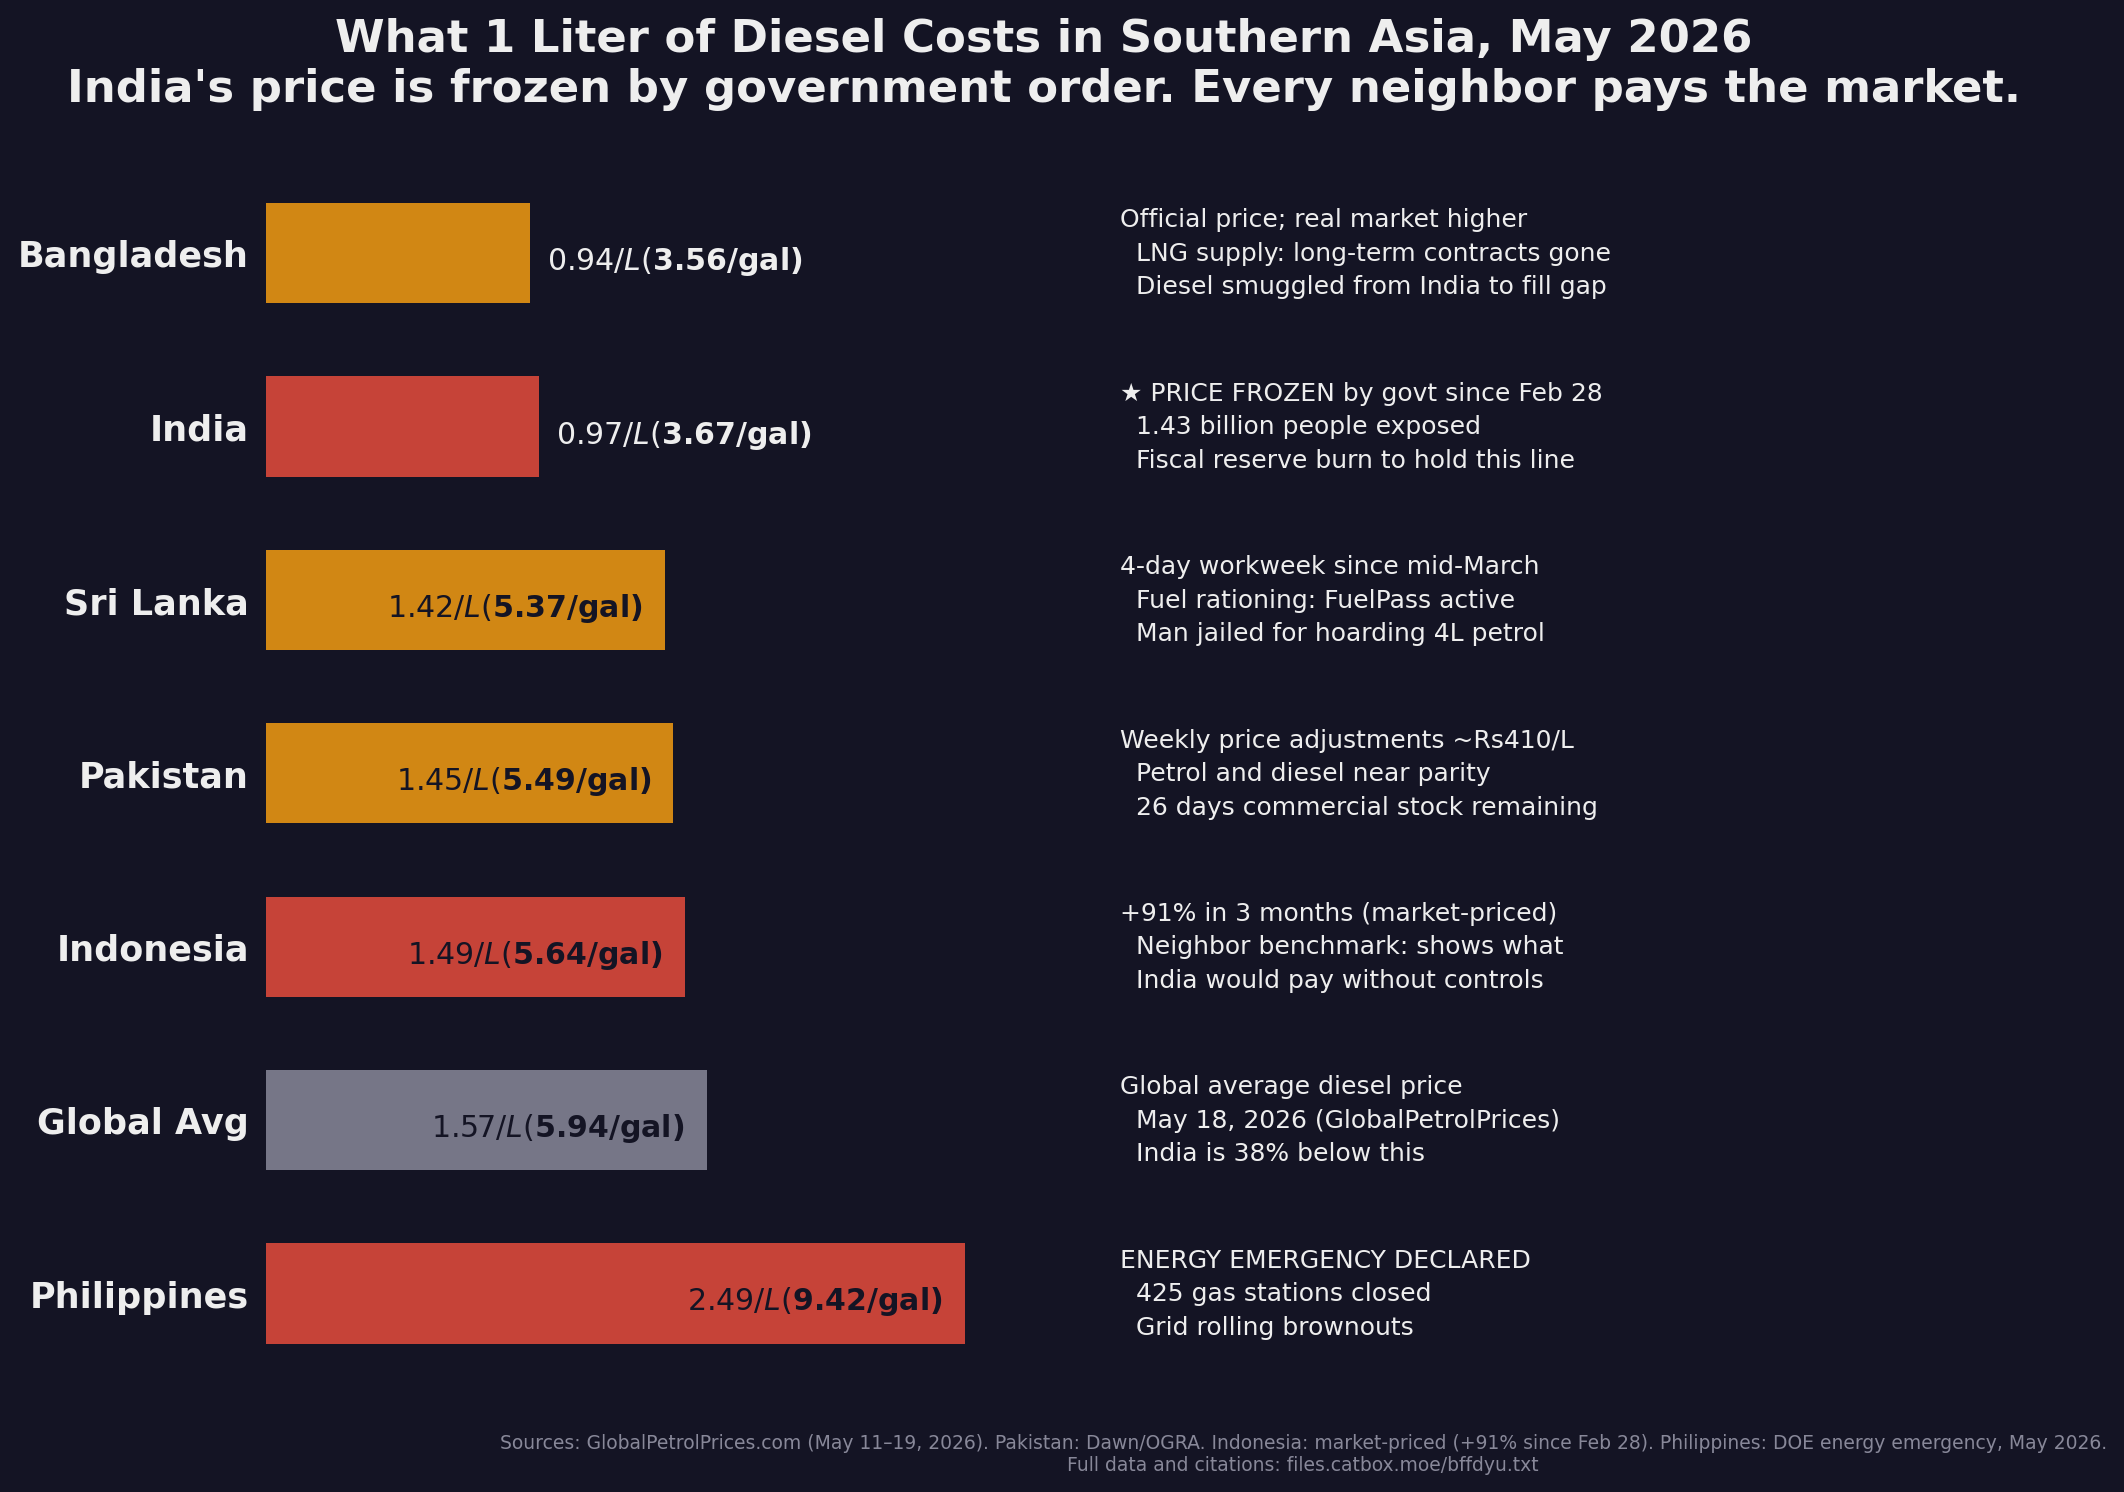
India (1.43B): Diesel frozen at $0.97/L ($3.67/gal) through excise cuts and OMC subsidies (Rs3/L hike on May 15 broke the freeze), a $0.60/L gap vs global average, costing billions a month. Forex: $697B, down $31B since February. 332M LPG connections on extended 25-45 day refill cycles. When the subsidy cracks, 1.43 billion feel it.

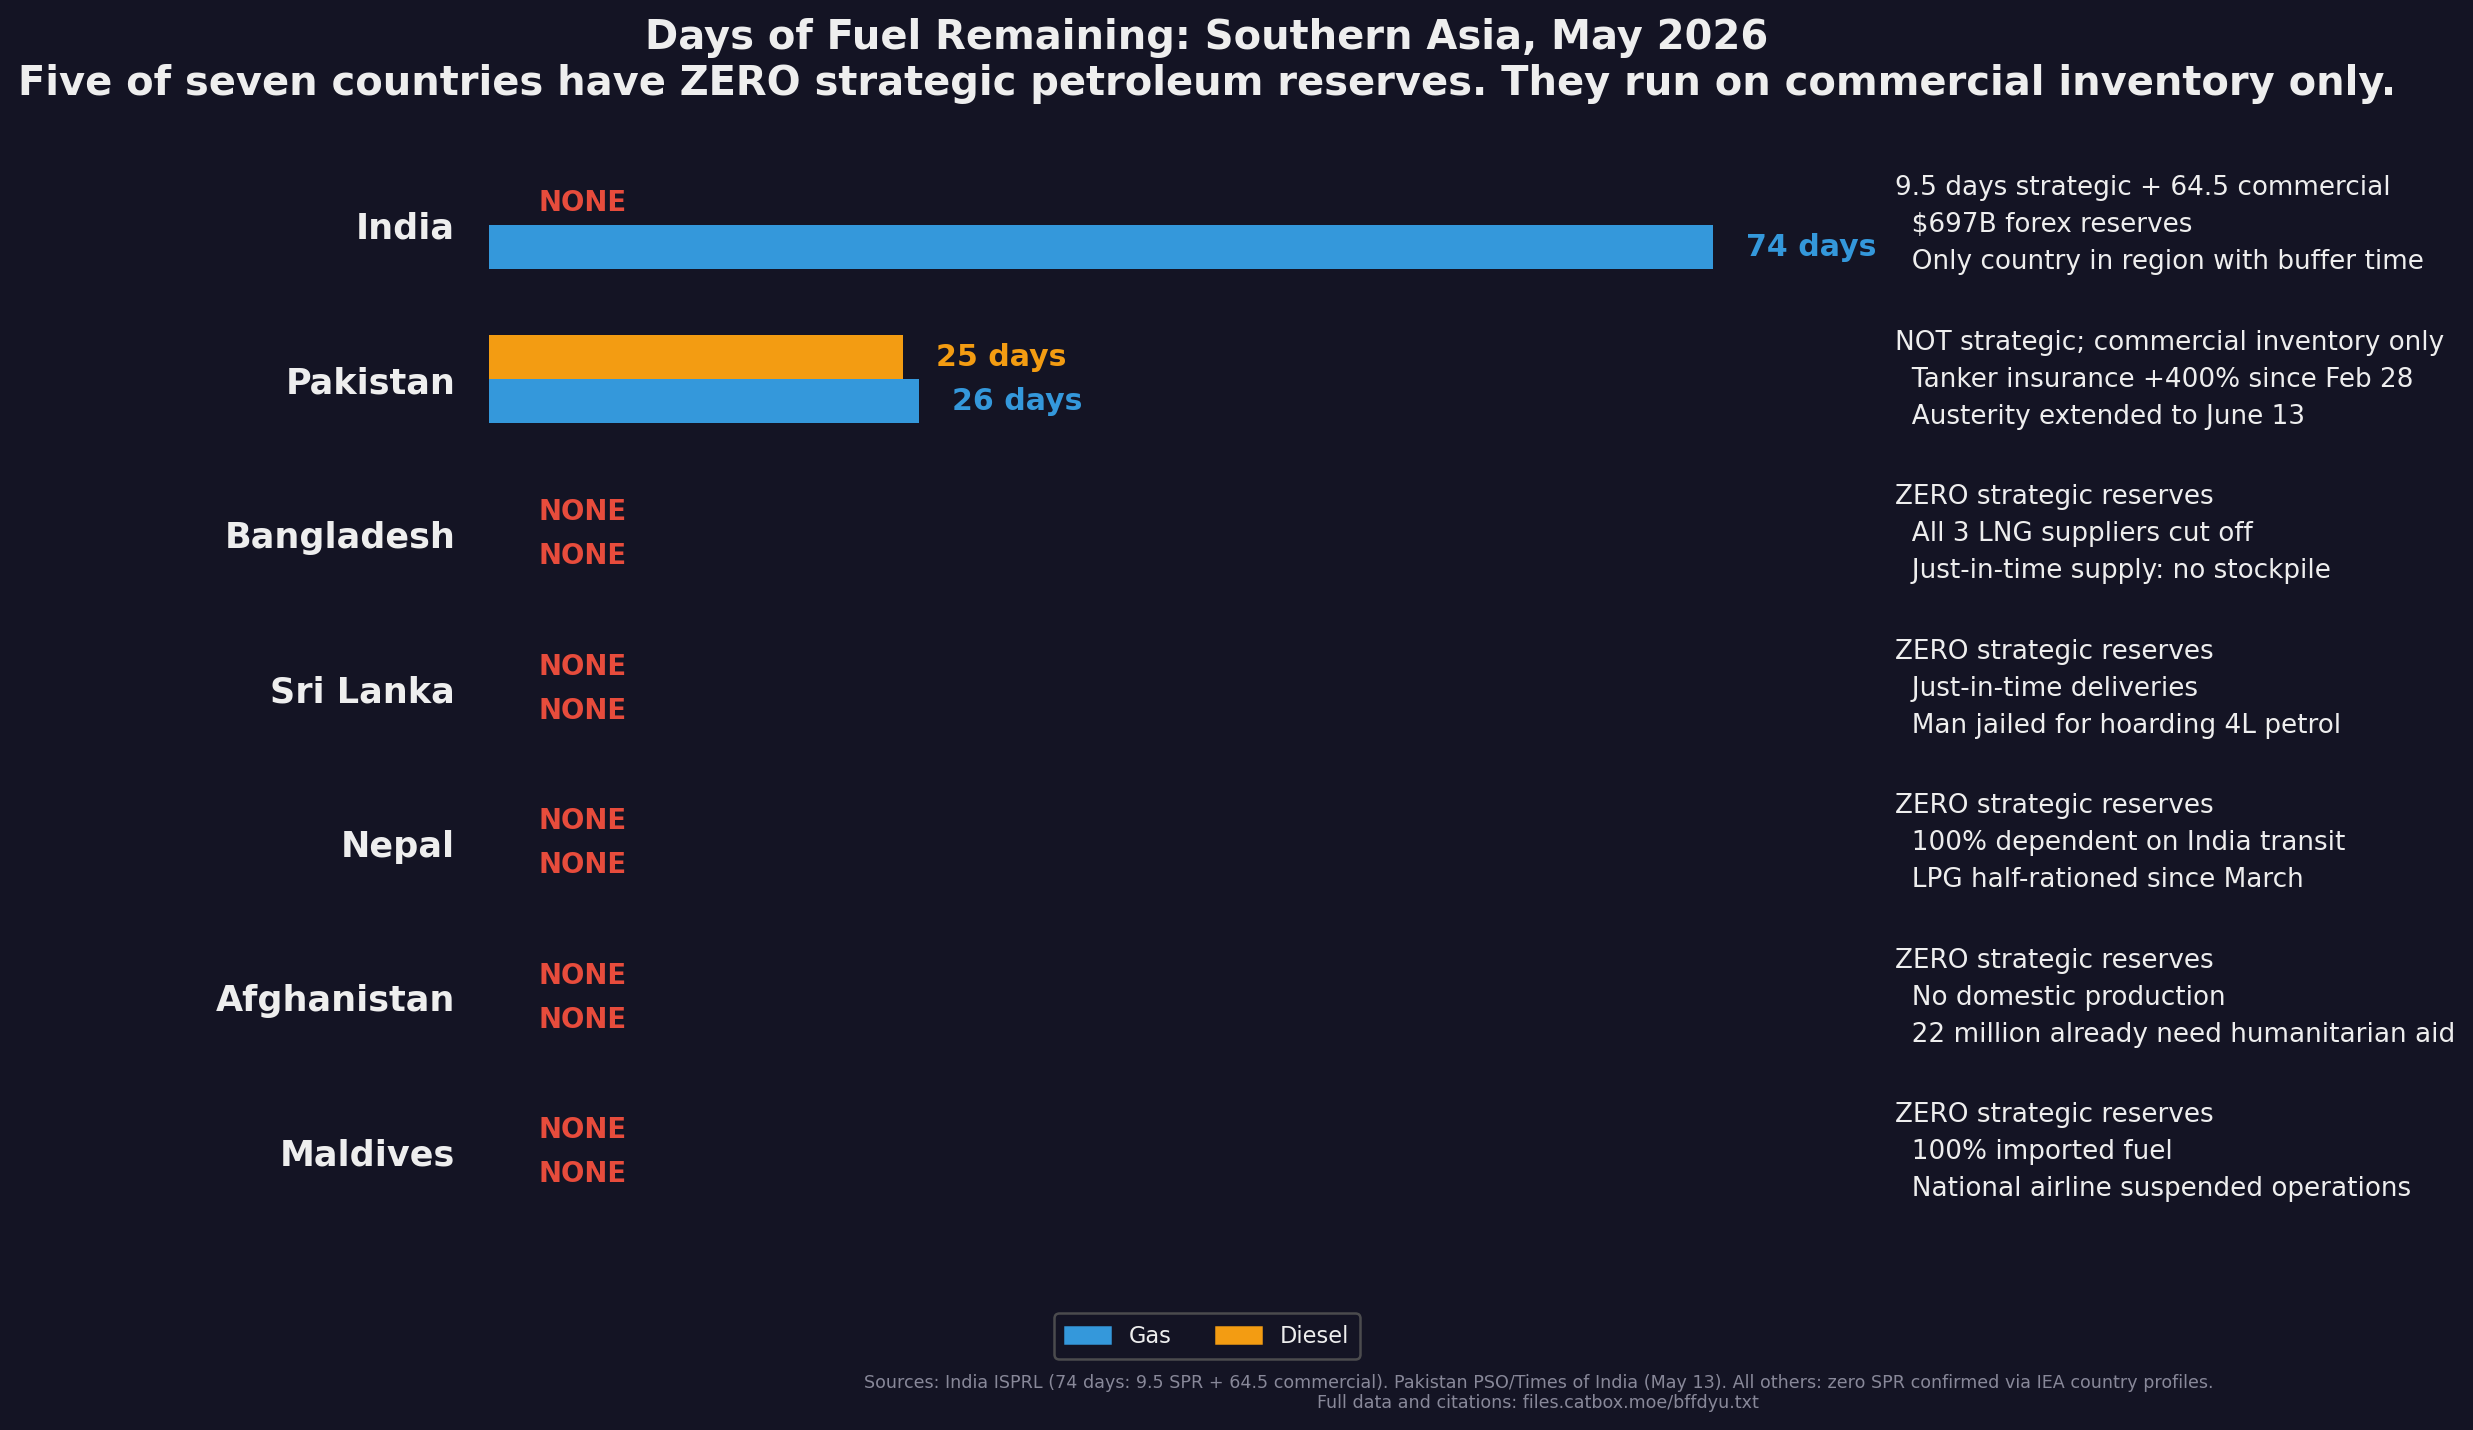
Pakistan (257M): ~26 days of petrol, ~25 days of diesel. Commercial working inventory, not reserves. March fuel hike of Rs55/L, largest in history. Now at Rs409.78/L petrol, Rs409.58/L diesel. Emergency diesel payments authorized (OGRA: Rs7.1B to PSO, May 13). Austerity through June 13.

Bangladesh (174M): Long-term LNG suppliers (Qatar, Shell, OQ) declared force majeure. At least 7 cargoes cancelled; forced to spot market at ~3x prices. Fertilizer plants mostly shut. Aman rice planting season approaches in July. 400+ garment factories shut in 3 years. 10-day fuel stocks, daily blackouts.

Sri Lanka (22M): 4-day workweek since mid-March. Diesel $1.42/L ($5.37/gal). $54.8B external debt, forex declining. Tourism stalling.

Nepal (31M): Landlocked, 100% dependent on India. Now Southern Asia's priciest fuel. LPG half-rationed since March 13. Remittances (~33% of GDP, roughly $14-15B) at risk if Gulf economies contract.

Afghanistan (43M): 21.9M need aid. WFP aid slashed from 10M to 2M. No oil, no reserves, no international finance. Fuel prices crippling WFP delivery.

Maldives (520K): Island nation, 100% import dependent. March tourist arrivals crashed 20.7%. Dollar black market premium ~35%. Private airline suspended until October.

A mid-March ceasefire proposal was rejected by Iran. On April 7, a two-week ceasefire was agreed to and extended. Operation Project Freedom, a US Navy escort mission launched May 4, was paused the next day. On May 18, Pakistan handed a revised Iranian peace proposal to Washington. On May 20, Trump proposed a broader peace framework to Israel, including a 30-day negotiation period and Strait of Hormuz reopening. The Strait remains effectively closed; negotiations continue for who knows how long.

If you're in Southern Asia, what are you seeing on the ground that matches or contradicts any of this?

Full glossary, sources, and infographics:
https://files.catbox.moe/08jjjf.txt

• Diesel prices comparison: https://files.catbox.moe/vw7ogd.png
• Fuel reserves comparison: https://files.catbox.moe/s7t7u1.png

Note: Southern Asian countries don't buy Brent. They import Middle Eastern crude priced against Dubai/Oman benchmarks, which trade at a premium during Gulf disruptions. We cite Brent because it's the global reference, the actual cost to these countries is higher.

(End of Summary)

Background

When Iranian forces mined and blockaded it on February 28, commercial shipping transit collapsed roughly 95%, traffic dropping from normal levels to near zero within days (World Economic Forum, April 2026). That removed ~17-20 million barrels per day from global markets, roughly 20% of world oil supply. The IEA calls it "the largest supply disruption since the 1970s energy crisis, and the largest in the history of the oil market." Eighty-one days later, Southern Asia still has no workaround.

A note on "closed": The Strait is not physically impassable: a few vessels still transit, paying IRGC tolls of up to $2M per ship. Even 5% of normal throughput is ~1M bpd still moving. But for the countries in this report, imports have collapsed ~90-95% and what gets through does so at ruinous cost.

What the world has done: Saudi Arabia's East-West Pipeline and the UAE's Fujairah pipeline (~6.8M bpd combined) bypass Hormuz entirely and are running near-maximum. The IEA's coordinated release of ~400M barrels from member SPRs (March 2026) bought time but is a finite bridge. After accounting for pipeline bypass and SPR releases, the remaining shortfall is roughly 10-12M bpd, what's driven the price surge (Brent peaked at $126/barrel per TradingEconomics).

Demand destruction: At $105-115 Brent, global demand doesn't sit still. IEA models suggest 1-2M bpd of demand destruction for every sustained $10 above $90. At crisis prices, 2-4M bpd is already eroding: drivers cutting trips, factories reducing shifts, airlines canceling routes. This is not a solution (it IS the crisis process for importers), but it is self-correcting. The worst-case scenarios below assume demand destruction is insufficient to close the gap.

Southern Asia has 1.96 billion people. It imports the vast majority of its oil, gas, and fertilizer through or from the Gulf. It has almost no strategic petroleum reserves. It entered this crisis already fragile: Bangladesh at 9%+ inflation, Pakistan at B- credit rating, Sri Lanka still recovering from its 2022 default. Afghanistan was already in a hunger crisis. Nepal was already rationing cylinders.

Country By Country

India: The Subsidy Trap

India imports 88-89% of its oil, roughly half normally via the Gulf and Hormuz.

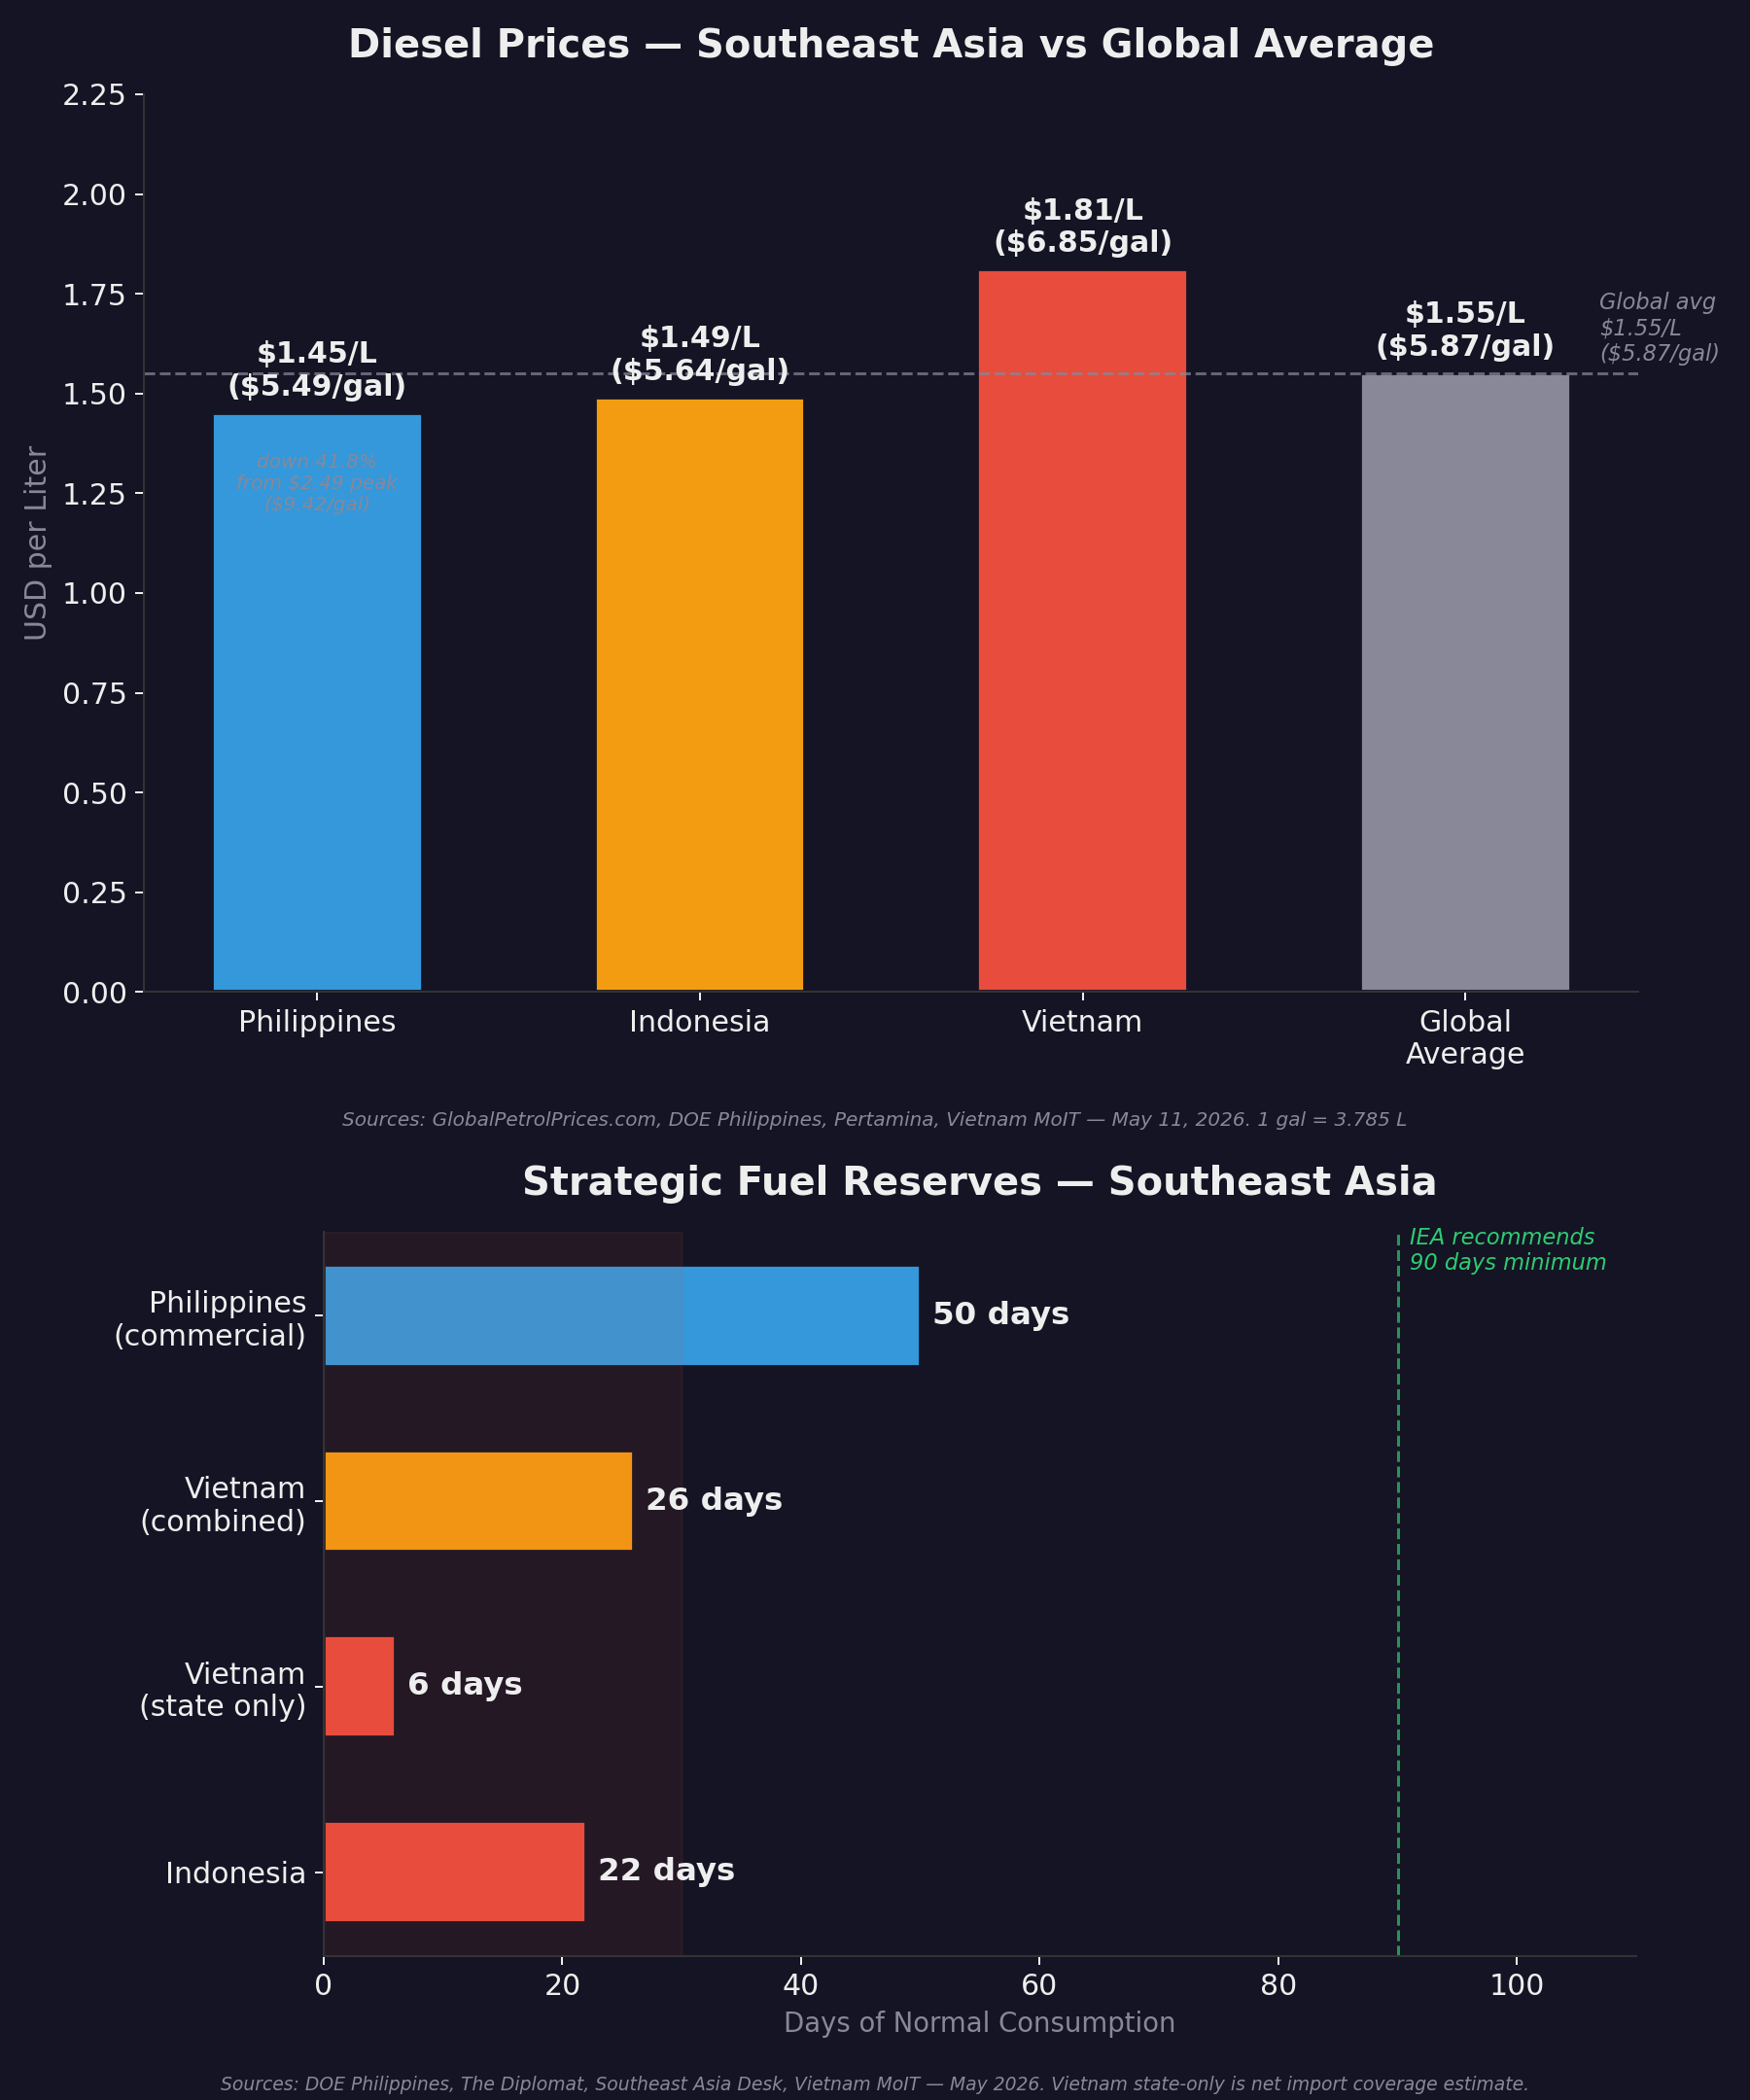
Diesel: $0.97/L ($3.67/gal). Effectively frozen for nearly three months through excise duty cuts and OMC subsidies. A Rs3/L hike on May 15 broke the freeze (Reuters, May 15); the first increase since the crisis began, but retail prices remain heavily subsidized. By comparison: global average diesel is $1.57/L ($5.94/gal) (GlobalPetrolPrices, May 18). Indonesia, with market pricing, is at $1.49/L ($5.64/gal) (+91% in 3 months). India's government is absorbing the difference, roughly $15-25B in additional subsidy cost at sustained $100+ Brent. The risk is not that India runs out of money tomorrow. It's that sustained subsidies force either a sharp adjustment or a gradual squeeze, and either path hits 1.43 billion people.

LPG: The cooking fuel emergency. 332 million LPG connections. ~60% of LPG is imported, almost all through Hormuz. Middle East-origin LPG shipments fell 75-80% in March-April (Kpler). The government raised domestic production from ~36,000 tons/day to 54,000 tons/day by mid-May and secured 650,000 tons of additional supply for May. Refill turnaround, normally 5-7 days, has been extended to 25 days for urban households, 45 days for rural (Ministry of Petroleum, May 2026). Commercial LPG cylinder prices were hiked Rs993 on May 1, the largest single increase on record. Restaurants in Mumbai began shutting in March. Gujarat's ceramics industry closed entirely. Families are reverting to firewood and biomass. This is a public health crisis in slow motion.

India has 74 days of total oil storage (9.5 days strategic + 64.5 days commercial). As of March, the strategic portion was only 64% full. $697B in forex reserves (RBI, May 15). ~70% coal power. India is far better positioned than its neighbors. But its 332 million LPG users have no backup. When the cylinder stops coming, the firewood starts.

Government response: Excise duties cut 10 rupees/L in late March. Export duties raised to keep supply domestic. Over 580,000 piped gas connections gasified or issued in March (domestic supply, unaffected by Hormuz). Coal power ramped up.

Pakistan: The Countdown

Pakistan spends roughly $15-17 billion annually on petroleum imports (pre-crisis run rate; weekly import bill surged from $300M to $800M, per PM Sharif, April 2026). Forex: ~$21.3B total ($15.87B SBP-held as of May 8). External debt: $138B. Credit rating: B- (S&P), Caa1 (Moody's).

Fuel stocks as of mid-May: ~26 days of petrol, ~25 days of diesel. Commercial working inventory, not strategic reserves. Pakistan has no SPR.

The math that doesn't work: At sustained $100+ oil, Pakistan's import bill approaches $30B, ~140% of total forex reserves. In March, petrol was hiked Rs55/L, the largest single increase in the country's history. By mid-May, prices sat at Rs409.78/L for petrol and Rs409.58/L for diesel after a token Rs5 cut on May 16 (Dawn). Weekly price revisions continue, but the Rs5 cut was political theater against a Rs55/L surge. OGRA ordered refineries to pay PSO Rs7.1 billion under emergency diesel pricing on May 13, confirming the crisis has reached emergency procurement levels.

Austerity: Extended through June 13. 50% cut in fuel allocations for government vehicles. 60% of government vehicles off the road. 4-day workweek. Ban on foreign travel by ministers.

The shipping crisis: Insurance exploded from near-zero to hundreds of thousands per voyage; freight from ~$900K to ~$4M per vessel. Pakistan State Oil has launched two emergency import tenders via alternative routes. Saudi Arabia has been asked to supply through the Red Sea.

Agriculture: Diesel for irrigation pumps and harvesters is at risk. Fertilizer imports through Hormuz are disrupted, threatening the kharif planting season.

Bottom line: Pakistan is not in freefall yet. Emergency tenders are securing spot cargoes at 2-3x cost. But the binding constraint is dollars: the import bill approaches ~140% of forex reserves at sustained crisis prices. Draw down the ~26-day working inventory without replacement and the system seizes. If alternative supply doesn't deliver by early June, escalating rationing is inevitable.

Bangladesh: The Silent Collapse

Bangladesh imports most of its oil and all of its LNG. Its energy mix: natural gas ~46-50% (down from 68%), oil ~22%, coal ~12-28%. It was scheduled for 115 LNG cargoes in 2026. After Qatar, its largest supplier, declared force majeure on March 3, other contracted suppliers (Shell, OQ) followed within days. At least 7 cargoes were cancelled. Bangladesh was forced to the spot market at nearly 3x pre-crisis prices. Spot LNG at $25-30/mmBtu prices its forex position cannot sustain at scale. The gas is physically available; the dollars to buy it are not. Forex: $35.1B gross, $30.5B net (April 24). External debt: $112B. Inflation: 9.04% (April 2026).

Fertilizer: The majority of Bangladesh's fertilizer plants are shut, lacking gas feedstock. Agriculture employs 35% of the workforce. Rice is the staple. The aman rice planting season (July-December) is approaching. Without fertilizer, yields drop substantially.

Garment industry: $38.8 billion in exports, the backbone of the economy. Over 400 garment factories have shut in three years even before the crisis, and the survivors need diesel for backup power and gas for production. Both are scarce. Industry groups are begging for emergency diesel allocations. International buyers will shift orders to countries with stable energy if disruptions continue: once supply chains reroute, they don't come back.

Government response: Universities closed early for Eid. Malls ordered closed by 7 PM. Coal power ramped up, but capacity is limited. Loadshedding daily; rural areas, where poverty is deepest, get the longest cuts.

Fuel prices: Diesel Tk 115/L ($0.94/L, $3.56/gal), petrol Tk 135/L ($1.10/L, $4.16/gal), octane Tk 140/L ($1.14/L, $4.32/gal). On April 19, Bangladesh raised all to record highs (diesel +Tk 15, octane +Tk 20, petrol +Tk 19), surpassing the 2022 Ukraine war peak. Prices are set by the Bangladesh Petroleum Corporation, not the market, so they appear administratively low. The crisis manifests as supply shortages: 10-day diesel stocks, queues at pumps.

Bottom line: No gas means no fertilizer. No fertilizer means lower yields. Lower yields mean higher food prices. Higher food prices mean garment workers cannot afford rice. This is the cascade that turns an energy crisis into a food crisis.

Sri Lanka: The Fragile Recovery, Crushed

Sri Lanka defaulted on its sovereign debt in 2022. It spent two years in an IMF program, clawing back to 5% GDP growth in 2024 and 2025. The Hormuz crisis has undone that recovery.

The 4-day workweek began in mid-March. Wednesdays off for public institutions. In effect until fuel supply improves. Indefinite.

The severity signal: In March 2026, a 48-year-old man was sentenced to three weeks in prison for hoarding 4 liters of petrol. An emergency spot cargo during the peak of the March panic reportedly cost $286 per barrel, confirmed by HSBC's CEO in April as "as high as $286 in at least one case" (Middle East Eye, April 15). A single cargo at the most extreme moment, not Sri Lanka's ongoing import cost. Ceylon Petroleum Corporation says its contracted crude is $72-113/barrel. Even at the lower end, the shipping premiums are punishing.

Fuel rationing: FuelPass quota system active. Weekly limits by vehicle type (~15L for cars), Sunday resets, odd-even in some areas. Current prices: diesel $1.42/L ($5.37/gal), 95 Octane $1.46/L ($5.53/gal). These are government-managed and don't guarantee fuel is actually at the pump.

Forex: $7.2B (February, declining to $7.0B by March). External debt: $54.8B. Government debt: $96.9B (91.6% of GDP). Cannot afford another round of crisis spending. No strategic reserves. Just-in-time commercial inventory. Any disruption causes immediate shortages. Being an island compounds it with a shipping premium on everything.

Tourism: The recovery engine is stalling. Airlines canceling routes. European and Middle Eastern tourists staying home. The Gulf, normally a source of visitors and remittances, is a war zone.

Bottom line: Sri Lanka was just getting back on its feet. The 2022 default recovery took two years. Now reserves are declining, tourism is collapsing, and there is no fuel buffer. The risk of slipping back toward crisis territory is real.

Nepal: The Transit Trap

Population: 31 million. GDP per capita: ~$1,500.

Nepal is landlocked between India and China. Every liter of oil and LPG enters through India. India's subsidized fuel system is Nepal's supply chain. India's LPG crisis is Nepal's LPG crisis. As of May 2026, Nepal is Southern Asia's priciest place to fill a tank (Global Voices, May 7).

LPG rationing began March 13. The state-run Nepal Oil Corporation now refills only half of each consumer's empty cylinder, citing the need to "lengthen liquid petroleum stockpiles" (Reuters, March 12). Half-cylinder rationing means families consume less. Triage, not stability. LPG is the primary cooking fuel for urban Nepal. Rural households rely on firewood and biomass: deforestation and respiratory illness. The half-cylinder policy hits urban families hardest, exactly the population with no fallback.

Remittances: Roughly 33% of GDP (~$14-15B annually), from Nepali workers in the Gulf, Malaysia, and South Korea. Remittances grew 31.9% in dollar terms through Q3 FY2025-26 (Kathmandu Post). But that was before the Hormuz crisis fully hit. If Gulf economies contract, the pipeline funding a third of Nepal's GDP shrinks. For families depending on a relative abroad for food and fuel money, the crisis hits twice: the fuel costs more, and the money to buy it may disappear.

Tourism: Everest spring and autumn trekking are Nepal's two forex windows. Fuel costs drive airfares higher. The autumn season faces real headwinds.

Bottom line: Nepal's crisis is downstream of India's. If India's subsidy regime cracks, Nepal feels it first: the supply chain reaches Nepal last. The half-cylinder rationing is the warning shot.

Afghanistan: The Hunger Crisis That Fuel Prices Will Break

Population: 43 million. GDP per capita: ~$360.

Afghanistan was already in one of the world's worst humanitarian crises: 21.9 million people (nearly half the population) require humanitarian assistance. Nearly 5 million mothers and children are affected by malnutrition. WFP cut food assistance from 10 million people to just 2 million earlier this year due to a funding crisis, and warned on May 15, 2026 that soaring fuel prices and disrupted Middle East supply routes are pushing operational costs higher (UN News).

The Taliban government has no access to international finance, no strategic reserves, no oil production, no refining capacity. Afghanistan imports all fuel, primarily through Pakistan and Iran, both in crisis.

Over 600,000 Afghans have returned from Iran and Pakistan in the first four months of 2026, arriving in a country with no jobs, no fuel, and no food surplus. Food prices have eased slightly from their peak but remain unaffordable for most (WFP). When diesel doubles, food transport doubles. In a country where 90%+ of the population is food-insecure, the margin between hunger and famine disappears.

The Hormuz crisis is not the cause of Afghanistan's hunger. It is the multiplier. When aid agencies cannot afford fuel for trucks, food does not move.

Maldives: The Luxury Destination Running on Empty

Population: 520,000. 1,192 islands. Imports everything. Tourism generates the dollars to pay for it: $361M in tourism tax revenue in 2025.

The dollar crisis predates Hormuz. The black market USD rate was MVR 19.70 in mid-2025 (28% premium over official MVR 15.42). By May 2026 the premium widened to ~35%. Importers couldn't get dollars from banks before the crisis. Now they can't get fuel at any price.

Beond, a private all-business-class airline, suspended all flights until October 2026 citing fuel prices and Middle East airspace closures. Tourist arrivals crashed 20.7% in March alone; annual projection is 4-6% decline with revenue losses exceeding $500 million.

Richest country in Southern Asia per capita, but the most brittle. Every link: jets, generators, speedboats, cargo ships, runs on petroleum. When any link breaks, the Maldives becomes unreachable.

Bhutan (790K)

Landlocked in the Himalayas, 100% dependent on India for fuel transit. India's managed fuel pricing and supply determine Bhutan's fuel access. The economy is small enough that India can absorb the cost for now. If India's own supply tightens, Bhutan is at the end of the pipe.

Why Southern Asia Breaks First

  1. LPG is survival, not convenience. Hundreds of millions cook every meal with it. No scalable alternative. Piped gas is rare. Electric cooking requires a grid already strained. The fallback is firewood and biomass: respiratory disease, deforestation, hours of labor borne by women.
  2. The landlocked amplify the coastal crisis. Nepal, Afghanistan, and Bhutan have no ports. Every barrel crosses a border from a neighbor also in crisis. The transit countries get supply first. The landlocked get what's left. India and Pakistan are ramping coal generation, but coal imports face the same shipping chaos: triage, not strategy.

Scenarios

Best case: Strait reopens by July following a diplomatic resolution. The May 20 Trump peace framework and the May 18 Pakistani-mediated Iranian proposal are the two active tracks. Demand destruction (~2-4M bpd) combines with resumed Gulf supply to push oil toward $80-90. The IEA's 400M-barrel emergency release bridged the gap. Pakistan stretches its buffer through alternative supply. India eases LPG controls gradually. Bangladesh restarts fertilizer plants for late aman planting. Nepal's rationing ends. Sri Lanka avoids default. Recovery begins late Q3.

Base case (what the data supports): Strait remains disrupted through summer. Brent $95-125. Demand destruction accelerates but cannot fully close a 10-12M bpd supply gap. Pakistan exhausts commercial stocks by mid-June, shifts to emergency allocation. The constraint is dollars, not physical supply, but the result is escalating rationing. India holds diesel subsidies through June but begins a gradual adjustment. Bangladesh loses the aman planting season, rice yields down 20-30%. Sri Lanka's forex runs out, default by August. Nepal's rationing deepens as India diverts supply inward. Afghanistan's aid delivery system breaks down. Maldives tourism collapses.

Worst case: Strait closed through 2026, no diplomatic resolution. Brent $150+. Demand destruction hits 5-7M bpd, a deep recession. Pakistan: fuel for military and hospitals only; agriculture collapses. Bangladesh: severe food crisis as aman and boro rice cycles disrupted, garment industry loses half its orders. India: tens of millions revert to biomass cooking as LPG refill periods extend past survivable limits. Nepal: cylinders stop, urban crisis turns rural. Afghanistan: mass starvation. Maldives: ceases to function as an economy. Sri Lanka: hospitals without power, water treatment without chemicals.

What Can Be Done

Governments: Ration by priority sector BEFORE reserves hit tank bottoms: food first, hospitals second. Secure LPG from alternative sources at any diplomatic cost. Cash transfers to the poor, not fuel subsidies that subsidize SUV owners. Prioritize diesel for irrigation pumps and food transport. Build strategic reserves to 90 days minimum. Tell people what's coming: silence breeds panic.

Fuel prices, reserve levels, and crisis conditions change rapidly. All claims cited with links where available. Scenario projections are analysis, not predictions.

u/alemorg — 19 hours ago

Southeast Asia Is Getting Crushed By the Hormuz Crisis. Here's What the Data Says Is Coming.

TLDR (Brief Summary)

(I edited from Apple iOS notes app, then pasted into Reddit mobile app and the bullets and indents aren’t working as intended and the bolded text didn’t either. Could someone let me know why? I’ve spent so much time trying to fix that lol, also I tried posting on the /oil subreddit and it was taken down again, so you guys saw it here first)

The Strait of Hormuz has been closed for 80 days.

The numbers that matter:
• Philippines: Diesel hit $2.49/L ($9.42/gal) in April before government crashed it to $1.45/L ($5.49/gal). Still +58% from three months ago. 400+ filling stations closed. 2 million people facing brownouts. First SEA country to declare a national energy emergency.
• Indonesia: Diesel at all-time high $1.49/L ($5.64/gal, +88% YoY). Only 21-23 days of reserves, the lowest in the region. 65 million households cook with LPG, 70% imported. Rationing already live: 50L/day cap for private vehicles.
• Vietnam: Best position with two domestic refineries covering ~68% of demand, but diesel at $1.81/L ($6.85/gal), above the global average. State reserves just 5-7 days of net imports.

The Singapore blind spot: Singapore is the region's refining hub. If Middle Eastern crude stops flowing to Singapore, every country that buys Singaporean diesel (Philippines, Indonesia, Vietnam) loses supply simultaneously.

Shipping collapse: Hormuz went from 70-80 vessels/day to single digits. 20 million barrels/day → near zero. Rerouting around Africa adds 10-20 days transit. Freight rates +29%. LNG spot +140%.

If the strait stays closed through summer: Indonesia hits tank bottoms late May to early June. 5-10 million below poverty by August.

Malaysia is a net exporter with its own production.

Charts

Diesel prices and strategic fuel reserves across Southeast Asia:

SEA Oil Crisis Charts

Diesel prices shown per liter and per gallon. Sources: GlobalPetrolPrices.com, DOE Philippines, Pertamina, Vietnam MoIT, The Diplomat, Southeast Asia Desk. May 2026.

Note: Fuel prices and reserve figures draw from national regulators and press reports during a fast-moving crisis. Specific prices may shift day to day. Where possible, verification dates are noted. All claims are cited; some sources are data portals where specific pages change. This is analysis, not investment advice.

The Strait of Hormuz has been closed for 80 days as of May 19, 2026. Nearly 20% of the world's oil trade normally transits Hormuz, and with the Strait closed, the IEA calls this "the largest supply disruption in the history of the global oil market," larger than the 1973 oil shock that created the IEA itself.

Global diesel: $1.55/L ($5.87/gal) average.

The Singapore blind spot: Singapore is Southeast Asia's refining powerhouse. It imports Middle Eastern crude and exports the diesel, gasoline, and jet fuel that the Philippines, Indonesia, and Vietnam buy. If the Strait stays closed, Singapore's refineries run dry. The whole region loses its gas station at once, long before individual countries hit their tank bottoms.

The shipping collapse makes it worse. Before the war, 70 to 80 vessels transited Hormuz daily. By the second week of March, that number was in single digits. Crude and product flows through the Strait collapsed from roughly 20 million barrels per day to a near standstill; the IEA now describes the resumption of flows through the Strait as "of paramount importance for the oil market." Ships now reroute around the Cape of Good Hope, adding 10 to 20 days of transit time per voyage. Freight rates on Far East to US routes jumped 29%. Asian LNG spot prices spiked 140%. Singapore and Malaysia's Port Klang are both reporting severe congestion as redirected vessels overwhelm port capacity. The IRGC imposed tolls of up to $2 million per ship for passage through the Strait. War-risk insurers pulled coverage. GPS jamming in the Gulf now affects over 1,600 vessels.

Philippines: First To Crack

The Philippines imports 98% of its crude oil. The transport sector consumes nearly two-thirds of all petroleum used in the country. FIRST in Southeast Asia to declare a national energy emergency (March 24).

•	Diesel hit an all-time high of PHP 153.70 ($2.49/L, $9.42/gal) on April 13. Government intervention crashed it to PHP 89.50 ($1.45/L, $5.49/gal) by May 11, but still +58% from three months ago.  
•	Gasoline: PHP 134.50 ($2.17/L, $8.21/gal), well above the $1.51/L ($5.72/gal) global average.  
•	Over 400 filling stations closed. Logistics rates jumped 30% as diesel surged. Brownouts hit nearly 2 million people in mid-May as power plants ran dry.  
•	The Philippine Institute for Development Studies estimates 1.3 to 3.1 million Filipinos could fall into poverty.  
•	A transport strike shut down Manila for two days.  
•	Fuel reserves dropped from 55-57 days to 45 days by March 20, but recovered to 51 days by March 27 and 54 days by late April after aggressive procurement.  
•	LPG stocks were \~24 days in late March. The Philippines imports roughly 80% of its LPG from the Middle East.

Government measures: 20B pesos from the Malampaya gas fund for fuel procurement. 20B pesos in subsidies to ~300K transport workers. LPG and kerosene excises removed (RA 12316). 329K barrels of diesel procured from Malaysia, 700K barrels from Russia under US sanctions waiver. Cebu Pacific and Philippine Airlines suspended routes to conserve fuel. Schools shifted to flexible learning. Malls cut operating hours.

Indonesia: All-Time Highs, Razor-Thin Reserves

Indonesia produces some of its own oil but hasn't built a major refinery in decades. It imports ~63% of its refined fuel and ~70% of its LPG. Strategic reserves: just 21-23 days, among the lowest in the region.

•	Diesel: IDR 26,000/L ($1.49/L, $5.64/gal). ALL-TIME HIGH. +77.8% month-over-month, +88.3% year-over-year.  
•	A 40L tank costs 8.1% of monthly income at the average; the poorest pay a far bigger share.  
•	Gasoline remains subsidized at $1.20/L ($4.54/gal), masking the real price.

Prabowo moved fast: capped fuel prices, and secured LNG and oil deals with Japan, South Korea, and Russia (Indonesia also has a February trade agreement with the US obligating ~$15B/year in US energy imports). On the biodiesel front, he went further: the B40 mandate (40% palm oil blend) was already cutting diesel imports. In late March, during a visit to Japan, Prabowo reinstated the B50 mandate, a 50% blend that had been scrapped in January due to technical and funding concerns. The Hormuz crisis made aggressive diesel substitution an urgent national priority. B50 demands an additional 2.2 to 2.3 million tons of crude palm oil per year, diverting roughly 8% of Indonesia's palm oil export volume (or about 4-5% of total production) into fuel tanks, on top of what B40 already consumes. However, only three of the five large-scale processing plants required are currently under construction, so implementation faces serious bottlenecks.

Rationing is already live. Starting April 1, subsidized fuel purchases are capped at 50 liters per day for private vehicles, 80L for public transport, 200L for large trucks under BPH Migas Decree No. 024/2026, enforced via the MyPertamina digital system. The price gap between subsidized and non-subsidized diesel is over Rp 16,800/L ($0.96/L, $3.63/gal), a cliff that destroys margins for any fleet that exceeds its cap.

But you can't close a 63% import gap overnight. 65 million households cook with LPG. Analysts project tank bottoms could hit between late May and early June; if so, Indonesia faces deeper rationing or ruinous subsidy spending.

Vietnam: The Best Buffer, Still Bleeding

Vietnam has the best position: two domestic refineries (Dung Quat and Nghi Son) cover ~68% of demand, plus its own crude production.

•	Diesel: VND 44,500/L ($1.81/L, $6.85/gal), significantly above the $1.55/L ($5.87/gal) global average.  
•	Fuel reserves increased to 26 days (up from 15 before the crisis), according to Minister of Industry and Trade Le Manh Hung. The government plans further increases.  
•	Vietnam's plan to procure 4 million barrels of non-Middle Eastern crude equals roughly six days of consumption, useful buffer, not a solution.  
•	Vietnam cut fuel taxes, activated price stabilization funds, and cut import tariffs to zero for non-FTA partners.  
•	Vietnam imports \~70% of its crude from the Middle East, a dependency the government is now racing to diversify.

The food multiplier: Vietnam is the world's third-largest rice exporter. If the strait stays closed through planting season, fertilizer costs spike and rice yields drop. The Persian Gulf supplies over 30% of global urea, the nitrogen fertilizer that Vietnam's rice paddies depend on. The Philippines and Indonesia are major buyers of Vietnamese rice. When fuel and fertilizer both spike at the same time, food and fuel shortages compound.

The Archipelago Problem

The Philippines (7,641 islands) and Indonesia (17,000+ islands) face brutal arithmetic no land-based country deals with: fuel distribution burns fuel. Every liter of diesel burned on an inter-island ferry is a liter that doesn't reach a fishing boat or a generator. Islands at the end of the chain (Palawan, Maluku, Eastern Visayas, Papua) get hit first and hardest, exactly where poverty is deepest.

When ships can't get diesel, the supply chain for everything breaks. This happens during typhoons locally. In this scenario, it would be national and prolonged.

Hidden Ripple Effects

•	Singapore Dries Up: SEA's refining hub relies on Middle Eastern crude. If Singapore stops refining, every country that buys its fuel (Philippines, Indonesia, Vietnam) loses supply simultaneously. National reserve numbers stop mattering when the regional gas station is empty. Port congestion from redirected vessels is already a problem.  
•	B50 = Cooking Oil Pressure: Indonesia's reinstated B50 biodiesel mandate (50% palm oil in diesel) diverts an additional 2.2 to 2.3 million tons of crude palm oil per year into fuel tanks. Indonesia produces \~60% of global palm oil. The mandate is active. Global cooking oil prices face sustained upward pressure, hitting developing countries that import palm oil for food the hardest.  
•	The Coal Threat: The Philippines relies on Indonesian coal for baseload power (\~85% of coal imports). If Indonesia restricts coal exports to secure its own grid in a panic, the Philippine grid goes dark, not brownouts, blackouts.  
•	Malaysia: Malaysia is a net oil and gas exporter with its own production, serving as a critical fuel lifeline to its neighbors (Philippines has already procured diesel from Malaysia).  
•	The Fertilizer Squeeze: The Gulf supplies 45% of global sulfur and over 30% of global urea. Sulfur is essential for phosphate fertilizer production. Urea is the most widely used nitrogen fertilizer on the planet. Southeast Asia's rice farmers are now competing with the world for a shrinking fertilizer supply, at prices that smallholders cannot absorb.  
•	Regional Inflation Already Spiking: Thailand's inflation hit 2.89% in April 2026, driven directly by the oil price surge. The Asian Development Bank projects 3.2% inflation for Southeast Asia in 2026.

Scenarios

Best case: Strait reopens by early June, oil drops to $70-75. The ~400 million barrels of emergency reserves released by the IEA bought enough time for most countries to avoid tank bottoms. Philippines keeps its refilled reserves above 50 days. Indonesia's rationing eases by July. Recovery begins in Q3.

If the strait stays closed through summer: Oil $100-130. Indonesia hits tank bottoms late May to early June; rationing deepens. Philippines burns through its recovered reserves if Singapore's refineries go dry. Vietnam holds at 26 days but faces diesel prices well above the global average. By August: 5-10 million below poverty, GDP near zero for the Philippines.

Worst case: Closed through 2026, oil $150+. Subsidy systems collapse. Islands lose deliveries. Inflation 15-20%. The archipelago supply chain breaks. Deep global recession.

What Can Be Done

Governments: Ration by priority sector BEFORE reserves hit tank bottoms. Secure LPG from alternative sources. Cash to transport workers, not fuel subsidies (those subsidize SUV owners). Prioritize fuel for inter-island cargo vessels. Build strategic reserves to 90 days minimum.

Families: Consolidate errands, share rides. If LPG runs short, cook with wood or charcoal outdoors. Community cooking saves fuel. Root vegetables store longer and need less fuel. Form mutual aid networks for shared fuel runs and bulk purchases.

Glossary

Hormuz: Strait between Iran and Oman. ~20% of global oil transits here. Closed since Feb 28, 2026.

Tank bottoms: Minimum operating level of a fuel storage tank. Below this (~10-15% of capacity), pumps fail and distribution stops.

LPG: Liquefied petroleum gas (propane/butane). Primary cooking fuel for hundreds of millions of households in Asia.

Strategic reserves: Government-held or mandated commercial oil/fuel stocks, measured in days of normal consumption. IEA recommends 90 days minimum.

B50 biodiesel: Indonesia's mandate blending 50% palm oil biodiesel with 50% conventional diesel. Reduces diesel imports but competes with food/cooking oil supply.

Brent crude: The global benchmark price for oil. ~$109/barrel as of mid-May 2026.

Jeepney: Philippine minibus (converted military jeep). The country's most common public transport. Runs on diesel.

Cape of Good Hope: Southern tip of Africa. The alternate shipping route when Hormuz/Suez are closed. Adds 10-20 days transit time.

OFW: Overseas Filipino Worker. Remittances from OFWs are a major pillar of the Philippine economy.

Pertamina: Indonesia's state-owned oil and gas company. Controls fuel pricing and LPG distribution.

Dung Quat / Nghi Son: Vietnam's two domestic oil refineries, covering ~68% of demand.

If you're in Southeast Asia, what are you seeing on the ground that matches or contradicts any of this?

Key sources:

IEA Sheltering From Oil Shocks report March 2026 ("largest supply disruption in the history of the global oil market")

IEA Oil Market Report March 2026

GlobalPetrolPrices.com (live diesel/gasoline, verified May 11 vs national regulators)

VietNamNet (Minister Le Manh Hung on 26-day reserves, Apr 10 2026)

EezyImport (Hormuz shipping collapse, freight rate data, port congestion, GPS jamming)

CNBC (Fatih Birol interview, Mar 23 2026)

Rappler / PhilStar / DOE (Philippine reserve levels)

Tempo.co / CNBC Indonesia (MyPertamina rationing)

Straits Times (Prabowo B50 reinstatement, Mar 30 2026)

UkrAgroConsult (B50 requires 2.2-2.3M tons additional CPO)

Advanced BioFuels USA (only 3 of 5 B50 plants under construction)

Xinhua (Thailand April 2026 inflation 2.89%, cites Trade Policy and Strategy Office)

ADB (projects 3.2% SEA inflation 2026)

Lowy Institute (Philippines energy dependency), IEEFA, The Diplomat, The Guardian

Archive links:

IEA Sheltering From Oil Shocks

IEA Oil Market Report March 2026

reddit.com
u/alemorg — 2 days ago
▲ 306 r/oil

Southeast Asia Is Getting Crushed By the Hormuz Crisis. Here's What the Data Says Is Coming.

Glossary and Sources with Links at the bottom. Please let me know if there are mistakes or anything else I can do to improve it.

TLDR (Brief Summary)

The Strait of Hormuz has been closed for 80 days.

The numbers that matter:

• Philippines: Diesel hit $2.49/L ($9.42/gal) in April before government crashed it to $1.45/L ($5.49/gal). Still +58% from three months ago. 400+ filling stations closed. 2 million people facing brownouts. First SEA country to declare a national energy emergency.

• Indonesia: Diesel at all-time high $1.49/L ($5.64/gal, +88% YoY). Only 21-23 days of reserves, the lowest in the region. 65 million households cook with LPG, 70% imported. Rationing already live: 50L/day cap for private vehicles.

• Vietnam: Best position with two domestic refineries covering ~68% of demand, but diesel at $1.81/L ($6.85/gal), above the global average. State reserves just 5-7 days of net imports.

The Singapore blind spot: Singapore is the region's refining hub. If Middle Eastern crude stops flowing to Singapore, every country that buys Singaporean diesel (Philippines, Indonesia, Vietnam) loses supply simultaneously.

Shipping collapse: Hormuz went from 70-80 vessels/day to single digits. 20 million barrels/day collapsed to near zero. Rerouting around Africa adds 10-20 days transit. Freight rates +29%. LNG spot +140%. GPS jamming affects 1,600+ vessels.

The archipelago problem: The Philippines (7,641 islands) and Indonesia (17,000+ islands) have fuel distribution that burns fuel. Every liter of diesel burned on an inter-island ferry is a liter that doesn't reach a fishing boat or a generator. Islands at the end of the chain get hit first, where poverty is deepest.

Fertilizer squeeze: The Persian Gulf supplies over 30% of global urea and 45% of global sulfur. Southeast Asia's rice farmers are now competing with the world for a shrinking fertilizer supply at prices smallholders cannot absorb.

Scenarios: Best case, Strait reopens by early June, oil drops to $70-75, recovery begins Q3. If closed through summer, oil $100-130, Indonesia hits tank bottoms late May to early June, 5-10 million below poverty by August. Worst case, closed through 2026, oil $150+, subsidy systems collapse, deep global recession.

Malaysia is a net exporter with its own production, serving as a critical fuel lifeline to its neighbors.

(End of Summary/ TLDR)

Charts:

Diesel prices and strategic fuel reserves across Southeast Asia:

SEA Oil Crisis Charts

Diesel prices shown per liter and per gallon. Sources: GlobalPetrolPrices.com, DOE Philippines, Pertamina, Vietnam MoIT, The Diplomat, Southeast Asia Desk. May 2026.

Note: Fuel prices and reserve figures draw from national regulators and press reports during a fast moving crisis. Specific prices may shift day to day. Where possible, verification dates are noted. All claims are cited; some sources are data portals where specific pages change. This is analysis, not investment advice.

The Strait of Hormuz has been closed for 80 days as of May 19, 2026. Nearly 20% of the world's oil trade normally transits Hormuz, and with the Strait closed, the IEA calls this "the largest supply disruption in the history of the global oil market," larger than the 1973 oil shock that created the IEA itself.

Global diesel: $1.55/L ($5.87/gal) average.

The Singapore blind spot: Singapore is Southeast Asia's refining powerhouse.
It imports Middle Eastern crude and exports the diesel, gasoline, and jet fuel that the Philippines, Indonesia, and Vietnam buy.
If the Strait stays closed, Singapore's refineries run dry.
The whole region loses its gas station at once, long before individual countries hit their tank bottoms.

The shipping collapse makes it worse. Before the war, 70 to 80 vessels transited Hormuz daily.
By the second week of March, that number was in single digits.
Crude and product flows through the Strait collapsed from roughly 20 million barrels per day to a near standstill; the IEA now describes the resumption of flows through the Strait as "of paramount importance for the oil market."
Ships now reroute around the Cape of Good Hope, adding 10 to 20 days of transit time per voyage.
Freight rates on Far East to US routes jumped 29%.
Asian LNG spot prices spiked 140%.
Singapore and Malaysia's Port Klang are both reporting severe congestion as redirected vessels overwhelm port capacity.
The IRGC imposed tolls of up to $2 million per ship for passage through the Strait. War-risk insurers pulled coverage.
GPS jamming in the Gulf now affects over 1,600 vessels.

Philippines: First To Crack

The Philippines imports 98% of its crude oil. The transport sector consumes nearly two-thirds of all petroleum used in the country. FIRST in Southeast Asia to declare a national energy emergency (March 24).

- Diesel hit an all-time high of PHP 153.70 ($2.49/L, $9.42/gal) on April 13. Government intervention crashed it to PHP 89.50 ($1.45/L, $5.49/gal) by May 11, but still +58% from three months ago.

- Gasoline: PHP 134.50 ($2.17/L, $8.21/gal), well above the $1.51/L ($5.72/gal) global average.
Over 400 filling stations closed. Logistics rates jumped 30% as diesel surged. Brownouts hit nearly 2 million people in mid-May as power plants ran dry.

- The Philippine Institute for Development Studies estimates 1.3 to 3.1 million Filipinos could fall into poverty.

- A transport strike shut down Manila for two days.

- Fuel reserves dropped from 55-57 days to 45 days by March 20, but recovered to 51 days by March 27 and 54 days by late April after aggressive procurement.

- LPG stocks were ~24 days in late March. The Philippines imports roughly 80% of its LPG from the Middle East.

Government measures: 20B pesos from the Malampaya gas fund for fuel procurement. 20B pesos in subsidies to ~300K transport workers. LPG and kerosene excises removed (RA 12316). 329K barrels of diesel procured from Malaysia, 700K barrels from Russia under US sanctions waiver. Cebu Pacific and Philippine Airlines suspended routes to conserve fuel. Schools shifted to flexible learning. Malls cut operating hours.

Indonesia: All-Time Highs, Razor-Thin Reserves

Indonesia produces some of its own oil but hasn't built a major refinery in decades. It imports ~63% of its refined fuel and ~70% of its LPG. Strategic reserves: just 21-23 days, among the lowest in the region.

- Diesel: IDR 26,000/L ($1.49/L, $5.64/gal). ALL-TIME HIGH. +77.8% month-over-month, +88.3% year-over-year.

- A 40L tank costs 8.1% of monthly income at the average; the poorest pay a far bigger share.

- Gasoline remains subsidized at $1.20/L ($4.54/gal), masking the real price.

Prabowo moved fast: capped fuel prices, and secured LNG and oil deals with Japan, South Korea, and Russia (Indonesia also has a February trade agreement with the US obligating ~$15B/year in US energy imports).

On the biodiesel front, he went further: the B40 mandate (40% palm oil blend) was already cutting diesel imports. In late March, during a visit to Japan, Prabowo reinstated the B50 mandate, a 50% blend that had been scrapped in January due to technical and funding concerns.

The Hormuz crisis made aggressive diesel substitution an urgent national priority. B50 demands an additional 2.2 to 2.3 million tons of crude palm oil per year, diverting roughly 8% of Indonesia's palm oil export volume (or about 4-5% of total production) into fuel tanks, on top of what B40 already consumes.

However, only three of the five large-scale processing plants required are currently under construction, so implementation faces serious bottlenecks.

Rationing is already live. Starting April 1, subsidized fuel purchases are capped at 50 liters per day for private vehicles, 80L for public transport, 200L for large trucks under BPH Migas Decree No. 024/2026, enforced via the MyPertamina digital system.

The price gap between subsidized and non-subsidized diesel is over Rp 16,800/L ($0.96/L, $3.63/gal), a cliff that destroys margins for any fleet that exceeds its cap.

But you can't close a 63% import gap overnight. 65 million households cook with LPG. Analysts project tank bottoms could hit between late May and early June; if so, Indonesia faces deeper rationing or ruinous subsidy spending.

Vietnam: The Best Buffer, Still Bleeding

Vietnam has the best position: two domestic refineries (Dung Quat and Nghi Son) cover ~68% of demand, plus its own crude production.

- Diesel: VND 44,500/L ($1.81/L, $6.85/gal), significantly above the $1.55/L ($5.87/gal) global average.

- Fuel reserves increased to 26 days (up from 15 before the crisis), according to Minister of Industry and Trade Le Manh Hung. The government plans further increases.

- Vietnam's plan to procure 4 million barrels of non-Middle Eastern crude equals roughly six days of consumption, useful buffer, not a solution.

- Vietnam cut fuel taxes, activated price stabilization funds, and cut import tariffs to zero for non-FTA partners.

- Vietnam imports ~70% of its crude from the Middle East, a dependency the government is now racing to diversify.

The food multiplier: Vietnam is the world's third-largest rice exporter. If the strait stays closed through planting season, fertilizer costs spike and rice yields drop. The Persian Gulf supplies over 30% of global urea, the nitrogen fertilizer that Vietnam's rice paddies depend on. The Philippines and Indonesia are major buyers of Vietnamese rice. When fuel and fertilizer both spike at the same time, food and fuel shortages compound.

The Archipelago Problem

The Philippines (7,641 islands) and Indonesia (17,000+ islands) face brutal arithmetic no land-based country deals with: fuel distribution burns fuel. Every liter of diesel burned on an inter-island ferry is a liter that doesn't reach a fishing boat or a generator. Islands at the end of the chain (Palawan, Maluku, Eastern Visayas, Papua) get hit first and hardest, exactly where poverty is deepest.

When ships can't get diesel, the supply chain for everything breaks. This happens during typhoons locally. In this scenario, it would be national and prolonged.

Hidden Ripple Effects

- Singapore Dries Up: SEA's refining hub relies on Middle Eastern crude. If Singapore stops refining, every country that buys its fuel (Philippines, Indonesia, Vietnam) loses supply simultaneously. National reserve numbers stop mattering when the regional gas station is empty. Port congestion from redirected vessels is already a problem.

- B50 = Cooking Oil Pressure: Indonesia's reinstated B50 biodiesel mandate (50% palm oil in diesel) diverts an additional 2.2 to 2.3 million tons of crude palm oil per year into fuel tanks. Indonesia produces ~60% of global palm oil. The mandate is active. Global cooking oil prices face sustained upward pressure, hitting developing countries that import palm oil for food the hardest.

- The Coal Threat: The Philippines relies on Indonesian coal for baseload power (~85% of coal imports). If Indonesia restricts coal exports to secure its own grid in a panic, the Philippine grid goes dark, not brownouts, blackouts.

- Malaysia: Malaysia is a net oil and gas exporter with its own production, serving as a critical fuel lifeline to its neighbors (Philippines has already procured diesel from Malaysia).

- The Fertilizer Squeeze: The Gulf supplies 45% of global sulfur and over 30% of global urea. Sulfur is essential for phosphate fertilizer production. Urea is the most widely used nitrogen fertilizer on the planet. Southeast Asia's rice farmers are now competing with the world for a shrinking fertilizer supply, at prices that smallholders cannot absorb.

- Regional Inflation Already Spiking: Thailand's inflation hit 2.89% in April 2026, driven directly by the oil price surge. The Asian Development Bank projects 3.2% inflation for Southeast Asia in 2026.

Scenarios

Best case: Strait reopens by early June, oil drops to $70-75. The ~400 million barrels of emergency reserves released by the IEA bought enough time for most countries to avoid tank bottoms. Philippines keeps its refilled reserves above 50 days. Indonesia's rationing eases by July. Recovery begins in Q3.

If the strait stays closed through summer: Oil $100-130. Indonesia hits tank bottoms late May to early June; rationing deepens. Philippines burns through its recovered reserves if Singapore's refineries go dry. Vietnam holds at 26 days but faces diesel prices well above the global average. By August: 5-10 million below poverty, GDP near zero for the Philippines.

Worst case: Closed through 2026, oil $150+. Subsidy systems collapse. Islands lose deliveries. Inflation 15-20%. The archipelago supply chain breaks. Deep global recession.

What Can Be Done

Governments: Ration by priority sector BEFORE reserves hit tank bottoms. Secure LPG from alternative sources. Cash to transport workers, not fuel subsidies (those subsidize SUV owners). Prioritize fuel for inter-island cargo vessels. Build strategic reserves to 90 days minimum.

Families: Consolidate errands, share rides. If LPG runs short, cook with wood or charcoal outdoors. Community cooking saves fuel. Root vegetables store longer and need less fuel. Form mutual aid networks for shared fuel runs and bulk purchases.

If you're in Southeast Asia, what are you seeing on the ground that matches or contradicts any of this? Also thank you guys so much for my the words of encouragement and positive support! Truly appreciate it. Just share, cross post, give me an upvote and credit!

Glossary

Hormuz: Strait between Iran and Oman. ~20% of global oil transits here. Closed since Feb 28, 2026.

Tank bottoms: Minimum operating level of a fuel storage tank. Below this (~10-15% of capacity), pumps fail and distribution stops.

LPG: Liquefied petroleum gas (propane/butane). Primary cooking fuel for hundreds of millions of households in Asia.

Strategic reserves: Government-held or mandated commercial oil/fuel stocks, measured in days of normal consumption. IEA recommends 90 days minimum.

B50 biodiesel: Indonesia's mandate blending 50% palm oil biodiesel with 50% conventional diesel. Reduces diesel imports but competes with food/cooking oil supply.

Brent crude: The global benchmark price for oil. ~$109/barrel as of mid-May 2026.

Jeepney: Philippine minibus (converted military jeep). The country's most common public transport. Runs on diesel.

Cape of Good Hope: Southern tip of Africa. The alternate shipping route when Hormuz/Suez are closed. Adds 10-20 days transit time.

OFW: Overseas Filipino Worker. Remittances from OFWs are a major pillar of the Philippine economy.

Pertamina: Indonesia's state-owned oil and gas company. Controls fuel pricing and LPG distribution.

Dung Quat / Nghi Son: Vietnam's two domestic oil refineries, covering ~68% of demand.

Key sources:

IEA Sheltering From Oil Shocks report March 2026 ("largest supply disruption in the history of the global oil market")

IEA Oil Market Report March 2026

GlobalPetrolPrices.com (live diesel/gasoline, verified May 11 vs national regulators)

VietNamNet (Minister Le Manh Hung on 26-day reserves, Apr 10 2026)

EezyImport (Hormuz shipping collapse, freight rate data, port congestion, GPS jamming)

CNBC (Fatih Birol interview, Mar 23 2026)

Rappler / PhilStar / DOE (Philippine reserve levels)

Tempo.co / CNBC Indonesia (MyPertamina rationing)

Straits Times (Prabowo B50 reinstatement, Mar 30 2026)

UkrAgroConsult (B50 requires 2.2-2.3M tons additional CPO)

Advanced BioFuels USA (only 3 of 5 B50 plants under construction)

Xinhua (Thailand April 2026 inflation 2.89%, cites Trade Policy and Strategy Office)

ADB (projects 3.2% SEA inflation 2026)

Lowy Institute (Philippines energy dependency), IEEFA, The Diplomat, The Guardian

Archive links:

IEA Sheltering From Oil Shocks

IEA Oil Market Report March 2026

u/alemorg — 2 days ago
▲ 1.4k r/Shortages+1 crossposts

Motor Oil Is The Next Shortage And It’s Just As Bad As Higher Gas Prices

The crude oil shortage is the main headline. Gasoline, diesel, jet fuel. But there is a downstream supply chain that is about to hit most car owners in America.

The AutoZone Memo

A leaked internal AutoZone memo is circulating, warning that the U.S. is facing "the largest supply shortage of lubricating fluids in the modern history of America" with "average available supply in this product category to drop by 40%."

Is the memo authentic? AutoZone corporate has not confirmed it. Carscoops reached out and received no reply as of May 15. But the data inside it is consistent with what multiple independent sources are reporting: JobbersWorld (the lubricant industry's primary trade publication), the Independent Lubricant Manufacturers Association (ILMA), ICIS, Shell's own public statements, and confirmed internal memos from Nissan and Toyota.

Nissan: 45% Allocation Cut, Confirmed

Nissan drafted an internal bulletin obtained by The Drive and confirmed as authentic by a Nissan spokesperson. The bulletin laid out a hard number: allocation of Nissan Genuine Oil (including Mobil and Mobil 1 variants) capped at 55% of prior-year volumes. A 45% cut. Effective May 1, 2026.

The bulletin includes draft customer talking points. The "why" section states the shortage affects all automakers, not just Nissan. From The Drive's reporting, the full text reads:

"We are writing to provide an important update regarding the availability of engine oil products across the Nissan network in the U.S. Due to ongoing global supply constraints impacting key raw materials and refining inputs due to the Middle East Conflict, we have been advised of reduced production capacity for most lubricant products. As a result, Nissan will be implementing the following adjustments, effective May 1, 2026. Allocation of Nissan Genuine Oil (including Mobil and Mobil 1 variants) will be constrained and managed at a 55% YoY level based on gallons purchased."

The Nissan spokesperson told The Drive that while the bulletin is real, it was never distributed to Nissan's dealer network. The May 1 effective date has come and gone without the memo being sent.

Source: The Drive, "Second Automaker Sounds Alarm Over Dwindling Motor Oil Stock [UPDATE]" (May 14, 2026)

Toyota: Substitution Guidelines, Unconfirmed

The Drive reported on May 14 that Toyota may have sent a service bulletin warning of a shortage of 0W-8 and 0W-16 oils. The bulletin, allegedly from Toyota and its supplier ExxonMobil, instructs dealers to use substitution guidelines, substituting heavier oil weights one day per week for 0W-8 and one day every other week for 0W-16.

Toyota has not confirmed the bulletin's authenticity. The Drive reached out to a Toyota spokesperson; as of publication time, Toyota had not responded. Based on comparisons to other known Toyota bulletins, The Drive assessed the document appears genuine. The substitutions are allowed for one service interval only, not a permanent fix.

Two of the world's largest automakers drafting rationing plans within days of each other is not a coincidence. It is a supply chain signal.

Source: The Drive, "Alleged Toyota Service Bulletin Warns of Looming Motor Oil Shortage" (May 14, 2026)

Why Motor Oil Specifically?

Motor oil is not pumped out of the ground and poured into a bottle. Modern synthetic passenger car motor oils (the kind required by nearly every car built in the last 15 years) require high purity Group III base oils. Group III base oils are the raw ingredient that makes synthetic oil synthetic.

The United States is a net importer of Group III base oils. Domestic production covers only 30% to 50% of demand.

JobbersWorld reported in March 2026, using U.S. Census Bureau and Global Trade Tracker data, that Middle Eastern sources (primarily Qatar, the UAE, and Bahrain) supplied more than 40% of total U.S. Group III supply for three consecutive years. In January 2026, that share climbed to approximately 55%.

Virtually all of these volumes must physically transit the Strait of Hormuz. The Strait has been functionally closed to commercial transit since February 28.

The AutoZone memo's 40% figure is not an estimate. It is a direct reflection of losing the specific import channel the U.S. depends on for modern synthetic oil.

The Pearl GTL Strike

Shell's Pearl gas to liquids (GTL) plant in Qatar's Ras Laffan Industrial City was struck by Iranian missiles on March 19, 2026. Shell confirmed the damage in a public statement: "no damage to train one and an initial assessment of around one year for full repair of train two."

Pearl GTL is one of the world's largest sources of premium Group III+ base oils, with the capacity to produce about 30,000 barrels of base oil per day, enough to fill 225 million cars per year, according to Shell's own website. One of two production trains was damaged. Shell's own estimate: approximately one year for full repair.

This is the plant that produces the base oil for Pennzoil's synthetic line made from natural gas. It produces base oil for Mobil 1 formulations. It is offline, and it is not coming back until mid-2027 at best.

Sources: Shell Plc public statement (March 2026); shell.com.qa, "GTL Products"

What "Synthetic" Actually Means

A dirty secret of the motor oil industry: in the United States, "synthetic" is a marketing term, not a chemical classification. Most oils sold as "full synthetic" are Group III base stocks refined from crude oil. ExxonMobil itself states: "There is no generally accepted definition of a synthetic base stock, or synthetic base oil. In the U.S., the government considers 'synthetic' to be a marketing term." And: "Most Group III base stocks are refined from crude oil streams."

This matters because if your car requires synthetic oil (and most modern turbocharged engines do), you cannot just substitute conventional. And the crude refining chain that produces Group III base oils is the same chain being squeezed by the Strait of Hormuz closure.

Not all Group III is interchangeable either. Group III+ grades used in 0W-20 and 0W-16 formulations (the weights specified by most new cars) have even fewer alternative sources. JobbersWorld's April 29 analysis identified these low-viscosity products as the single biggest point of exposure.

Source: ExxonMobil base stocks FAQ (via The Drive, May 14, 2026)

The ILMA / GM Dexos Fight

The Independent Lubricant Manufacturers Association formally requested that General Motors grant temporary flexibility under its dexos engine oil licensing program so blenders could use alternative base oils during the shortage. GM refused.

GM's position: no enforcement pause. License terminations will continue. Blenders have approximately one month of forward inventory. After that, companies without approved alternatives face "serious commercial and licensing risk, including potential termination."

Translation: the blenders who make the oil that goes into GM vehicles are being told by GM that if they cannot source Group III base oil to the exact dexos specification, they lose their license and cannot sell dexos-approved oil. Meanwhile, the Group III base oil physically does not exist on the spot market.

ILMA CEO Holly Alfano, from the ILMA website (April 3, 2026): "ILMA appreciates GM's response; however, we remain concerned by the OEM's decision not to provide temporary enforcement flexibility under these extraordinary circumstances."

Source: ILMA.org, "GM Responds to ILMA's Dexos Licensing Relief Request" (April 3, 2026)

Current Market Conditions

From JobbersWorld, March 24, 2026, and confirmed by Axios on May 15, 2026:

Spot availability for Group III base oils has "largely disappeared." Unless you have strong existing supply contracts, "you're not going to find it." Prices are escalating in what blenders describe as an "unstructured, less predictable manner." Some estimates put Group III prices approaching $2.00 per gallon above pre-crisis levels.

ICIS global lead for base oils Amanda Hay, speaking to Axios on May 15: "Actual shortages are starting to appear" for some synthetic oil products. "Security of supply is the chief concern for industry players."

Note: JobbersWorld is behind a paywall and cannot be independently accessed without a subscription. The Axios quotes were accessed on May 16, 2026 but cannot be re-verified in real time.

The Timeline: Worse Than Crude

Here is the critical distinction most people miss. Crude oil is a commodity. Group III base oils are a specialty refined product from specific plants.

JobbersWorld's April 8 analysis: even if the Strait of Hormuz reopens tomorrow, Group III relief "may take much longer" than crude relief. The market will bifurcate. Group I and II (conventional oils, industrial lubricants) will see faster relief. Group III and Group III+ will remain tight and expensive for months after any geopolitical resolution.

Why? Because Pearl GTL is physically damaged and takes a year to repair. Because supply chains for specialty base oils do not just snap back when tankers start moving again. Because blenders carrying one month of inventory will take months to restock the entire distribution chain.

The lubricant industry's traditional pricing playbook, built around predictable cost adjustments and long lag times, has broken. The market has shifted to what blenders describe as an "all-in" approach where simply securing supply is the dominant factor. Price is secondary.

What This Means For You

If you drive a modern car that requires synthetic oil (basically anything with a turbo, direct injection, or a 0W viscosity rating), here is where this lands:

Your next oil change is going to cost more. Possibly a lot more.
Your dealer or independent shop may not have your exact oil weight in stock. They may offer you an alternative that "meets spec" but was not what your engine was designed for.
If you are due for an oil change in the next month or two, do it now. The supply has not collapsed yet, but two automakers and the largest auto parts retailer in America are clearly preparing for exactly that.
This is not a "gas prices are high" problem. Gas prices can spike and then come back. Motor oil is a manufactured product from damaged and offline facilities with no short-term replacement. The timeline is months, not weeks.

Personal Note: First off I like to thank everyone for their comments made on my last oil post. This is a shortened post, it cannot factor in every possible scenario. I cannot tell the future, no one can. I am not making a prediction, do not ask me for one. I do not give financial advice, please don’t ask. I am working on region specific posts to go more into detail how bad this situation will be, because it depends on where you live. I am focusing on the area most at risk first, south east Asia, subsaharan Africa, Latin America. After that I will go on to wealthy Asian countries, Australia, Europe, and the U.S.. Linked below is my previous post. Thank you for reading, and take care.

https://www.reddit.com/r/oil/s/STKrSiDtjW

Edit: Adding a potential timeline. This is speculation, I cited sources. I made sure that I used all available information that I could, including checking current prices for motor oil, and oil changes (U.S.)

A 5-quart jug of Mobil 1 5W-30 still costs $26 at Walmart (Slickdeals, May 7). That's pre-crisis normal. It won't last.

Upstream, the market is broken. Independent shops now pay $25/gallon wholesale for 0W-20 synthetic, triple the February price (The Drive, May 15). It just hasn't reached the shelf yet. Argus Media told CNBC on May 1 that stocks will "run dry in a month" if nothing comes in. That clock points to early June.

Three paths from here, all subject to change as conditions shift:

Best: Hormuz reopens soon. Prices settle 20-40% above normal by late summer. Shelves stay stocked. Disruption is an annoyance, not a crisis.

Base: Hormuz stays shut through summer. Retail shortages start mid to late June, first in 0W-16 and 0W-20 synthetic. Broader gaps by August. Oil changes push past $150. This is the current trajectory.

Worst: Hormuz stays shut and a hurricane hits the Gulf Coast. ILMA warns a single storm could knock out 30-40% of US Group II production on top of the 44% Group III already lost. Shelves go bare. Oil changes hit $200+. Recovery stretches into 2027.

The Gulf Coast is best protected (refineries and ports are there). The West Coast and rural areas are most exposed. But the real divide is store size, not region. Walmart and AutoZone have national contracts and get priority allocation. Your local independent shop is bidding on whatever base oil is left on the spot market.

None of this is set in stone. If Hormuz reopens, the timeline shifts. If new supply routes emerge, the math changes. What's written here is the picture as of mid-May 2026 based on what blenders, distributors, automakers, and industry groups are saying publicly.

Sources: CNBC (May 1), The Drive (May 13-15), ILMA (May 11), Argus Media, Slickdeals (May 7), Carscoops (May 15), JobbersWorld (March-April 2026).

Sources

The Drive: "Second Automaker Sounds Alarm Over Dwindling Motor Oil Stock [UPDATE]" (May 14, 2026) Nissan bulletin confirmed authentic by Nissan spokesperson, 45% allocation cut at 55% of prior-year volumes, effective May 1, never distributed to dealers
The Drive: "Alleged Toyota Service Bulletin Warns of Looming Motor Oil Shortage" (May 14, 2026) Toyota bulletin unconfirmed by Toyota, substitution guidelines for 0W-8 and 0W-16, not a permanent fix
Carscoops: "AutoZone's Alleged Memo On Motor Oil Supply Is Ugly" (May 15, 2026) leaked memo, 40% supply drop, AutoZone did not respond to request for comment
Shell Plc: "Impact of Middle East conflict on Shell activities" (March 2026) confirms train two damage, ~1 year repair timeline, train one undamaged
Shell.com.qa: "GTL Products" 30,000 bpd base oil capacity, enough for 225 million cars per year
ILMA.org: "GM Responds to ILMA's Dexos Licensing Relief Request" (April 3, 2026) GM refuses enforcement flexibility, Holly Alfano statement
ExxonMobil base stocks FAQ (via The Drive) confirms "synthetic" is a U.S. marketing term, Group III refined from crude oil streams
JobbersWorld: "Group III Tightens as Prices Surge and Supply Constraints Deepen" (March 24, 2026) U.S. Census Bureau / Global Trade Tracker import data, spot availability "largely disappeared"
JobbersWorld: "After the Ceasefire: Hope for Lower Crude, But Group III Relief May Take Much Longer" (April 8, 2026) bifurcated recovery timeline
JobbersWorld: "Where Group III Actually Matters: A Practical Framework for Managing Lubricant Supply Risk" (April 29, 2026) Group III+ low-viscosity products identified as biggest exposure point
Axios: "Motor oil shortages are starting to appear amid Middle East disruptions" (May 15, 2026) ILMA, ICIS comments, Amanda Hay quote (behind Cloudflare, accessed May 16)

reddit.com
u/Own-Swan2646 — 4 days ago

Motor Oil Is The Next Shortage And It's Just As Bad As Higher Gas Prices

Edit: Check out my new post! https://www.reddit.com/r/oil/s/eId54J2x2P

The crude oil shortage is the main headline. Gasoline, diesel, jet fuel. But there is a downstream supply chain that is about to hit most car owners in America.

The AutoZone Memo

A leaked internal AutoZone memo is circulating, warning that the U.S. is facing "the largest supply shortage of lubricating fluids in the modern history of America" with "average available supply in this product category to drop by 40%."

Is the memo authentic? AutoZone corporate has not confirmed it. Carscoops reached out and received no reply as of May 15. But the data inside it is consistent with what multiple independent sources are reporting: JobbersWorld (the lubricant industry's primary trade publication), the Independent Lubricant Manufacturers Association (ILMA), ICIS, Shell's own public statements, and confirmed internal memos from Nissan and Toyota.

Nissan: 45% Allocation Cut, Confirmed

Nissan drafted an internal bulletin obtained by The Drive and confirmed as authentic by a Nissan spokesperson. The bulletin laid out a hard number: allocation of Nissan Genuine Oil (including Mobil and Mobil 1 variants) capped at 55% of prior-year volumes. A 45% cut. Effective May 1, 2026.

The bulletin includes draft customer talking points. The "why" section states the shortage affects all automakers, not just Nissan. From The Drive's reporting, the full text reads:

"We are writing to provide an important update regarding the availability of engine oil products across the Nissan network in the U.S. Due to ongoing global supply constraints impacting key raw materials and refining inputs due to the Middle East Conflict, we have been advised of reduced production capacity for most lubricant products. As a result, Nissan will be implementing the following adjustments, effective May 1, 2026. Allocation of Nissan Genuine Oil (including Mobil and Mobil 1 variants) will be constrained and managed at a 55% YoY level based on gallons purchased."

The Nissan spokesperson told The Drive that while the bulletin is real, it was never distributed to Nissan's dealer network. The May 1 effective date has come and gone without the memo being sent.

Source: The Drive, "Second Automaker Sounds Alarm Over Dwindling Motor Oil Stock [UPDATE]" (May 14, 2026)

Toyota: Substitution Guidelines, Unconfirmed

The Drive reported on May 14 that Toyota may have sent a service bulletin warning of a shortage of 0W-8 and 0W-16 oils. The bulletin, allegedly from Toyota and its supplier ExxonMobil, instructs dealers to use substitution guidelines, substituting heavier oil weights one day per week for 0W-8 and one day every other week for 0W-16.

Toyota has not confirmed the bulletin's authenticity. The Drive reached out to a Toyota spokesperson; as of publication time, Toyota had not responded. Based on comparisons to other known Toyota bulletins, The Drive assessed the document appears genuine. The substitutions are allowed for one service interval only, not a permanent fix.

Two of the world's largest automakers drafting rationing plans within days of each other is not a coincidence. It is a supply chain signal.

Source: The Drive, "Alleged Toyota Service Bulletin Warns of Looming Motor Oil Shortage" (May 14, 2026)

Why Motor Oil Specifically?

Motor oil is not pumped out of the ground and poured into a bottle. Modern synthetic passenger car motor oils (the kind required by nearly every car built in the last 15 years) require high purity Group III base oils. Group III base oils are the raw ingredient that makes synthetic oil synthetic.

The United States is a net importer of Group III base oils. Domestic production covers only 30% to 50% of demand.

JobbersWorld reported in March 2026, using U.S. Census Bureau and Global Trade Tracker data, that Middle Eastern sources (primarily Qatar, the UAE, and Bahrain) supplied more than 40% of total U.S. Group III supply for three consecutive years. In January 2026, that share climbed to approximately 55%.

Virtually all of these volumes must physically transit the Strait of Hormuz. The Strait has been functionally closed to commercial transit since February 28.

The AutoZone memo's 40% figure is not an estimate. It is a direct reflection of losing the specific import channel the U.S. depends on for modern synthetic oil.

The Pearl GTL Strike

Shell's Pearl gas to liquids (GTL) plant in Qatar's Ras Laffan Industrial City was struck by Iranian missiles on March 19, 2026. Shell confirmed the damage in a public statement: "no damage to train one and an initial assessment of around one year for full repair of train two."

Pearl GTL is one of the world's largest sources of premium Group III+ base oils, with the capacity to produce about 30,000 barrels of base oil per day, enough to fill 225 million cars per year, according to Shell's own website. One of two production trains was damaged. Shell's own estimate: approximately one year for full repair.

This is the plant that produces the base oil for Pennzoil's synthetic line made from natural gas. It produces base oil for Mobil 1 formulations. It is offline, and it is not coming back until mid-2027 at best.

Sources: Shell Plc public statement (March 2026); shell.com.qa, "GTL Products"

What "Synthetic" Actually Means

A dirty secret of the motor oil industry: in the United States, "synthetic" is a marketing term, not a chemical classification. Most oils sold as "full synthetic" are Group III base stocks refined from crude oil. ExxonMobil itself states: "There is no generally accepted definition of a synthetic base stock, or synthetic base oil. In the U.S., the government considers 'synthetic' to be a marketing term." And: "Most Group III base stocks are refined from crude oil streams."

This matters because if your car requires synthetic oil (and most modern turbocharged engines do), you cannot just substitute conventional. And the crude refining chain that produces Group III base oils is the same chain being squeezed by the Strait of Hormuz closure.

Not all Group III is interchangeable either. Group III+ grades used in 0W-20 and 0W-16 formulations (the weights specified by most new cars) have even fewer alternative sources. JobbersWorld's April 29 analysis identified these low-viscosity products as the single biggest point of exposure.

Source: ExxonMobil base stocks FAQ (via The Drive, May 14, 2026)

The ILMA / GM Dexos Fight

The Independent Lubricant Manufacturers Association formally requested that General Motors grant temporary flexibility under its dexos engine oil licensing program so blenders could use alternative base oils during the shortage. GM refused.

GM's position: no enforcement pause. License terminations will continue. Blenders have approximately one month of forward inventory. After that, companies without approved alternatives face "serious commercial and licensing risk, including potential termination."

Translation: the blenders who make the oil that goes into GM vehicles are being told by GM that if they cannot source Group III base oil to the exact dexos specification, they lose their license and cannot sell dexos-approved oil. Meanwhile, the Group III base oil physically does not exist on the spot market.

ILMA CEO Holly Alfano, from the ILMA website (April 3, 2026): "ILMA appreciates GM's response; however, we remain concerned by the OEM's decision not to provide temporary enforcement flexibility under these extraordinary circumstances."

Source: ILMA.org, "GM Responds to ILMA's Dexos Licensing Relief Request" (April 3, 2026)

Current Market Conditions

From JobbersWorld, March 24, 2026, and confirmed by Axios on May 15, 2026:

Spot availability for Group III base oils has "largely disappeared." Unless you have strong existing supply contracts, "you're not going to find it." Prices are escalating in what blenders describe as an "unstructured, less predictable manner." Some estimates put Group III prices approaching $2.00 per gallon above pre-crisis levels.

ICIS global lead for base oils Amanda Hay, speaking to Axios on May 15: "Actual shortages are starting to appear" for some synthetic oil products. "Security of supply is the chief concern for industry players."

Note: JobbersWorld is behind a paywall and cannot be independently accessed without a subscription. The Axios quotes were accessed on May 16, 2026 but cannot be re-verified in real time.

The Timeline: Worse Than Crude

Here is the critical distinction most people miss. Crude oil is a commodity. Group III base oils are a specialty refined product from specific plants.

JobbersWorld's April 8 analysis: even if the Strait of Hormuz reopens tomorrow, Group III relief "may take much longer" than crude relief. The market will bifurcate. Group I and II (conventional oils, industrial lubricants) will see faster relief. Group III and Group III+ will remain tight and expensive for months after any geopolitical resolution.

Why? Because Pearl GTL is physically damaged and takes a year to repair. Because supply chains for specialty base oils do not just snap back when tankers start moving again. Because blenders carrying one month of inventory will take months to restock the entire distribution chain.

The lubricant industry's traditional pricing playbook, built around predictable cost adjustments and long lag times, has broken. The market has shifted to what blenders describe as an "all-in" approach where simply securing supply is the dominant factor. Price is secondary.

What This Means For You

If you drive a modern car that requires synthetic oil (basically anything with a turbo, direct injection, or a 0W viscosity rating), here is where this lands:

Your next oil change is going to cost more. Possibly a lot more.
Your dealer or independent shop may not have your exact oil weight in stock. They may offer you an alternative that "meets spec" but was not what your engine was designed for.
If you are due for an oil change in the next month or two, do it now. The supply has not collapsed yet, but two automakers and the largest auto parts retailer in America are clearly preparing for exactly that.
This is not a "gas prices are high" problem. Gas prices can spike and then come back. Motor oil is a manufactured product from damaged and offline facilities with no short-term replacement. The timeline is months, not weeks.

Personal Note: First off I like to thank everyone for their comments made on my last oil post. This is a shortened post, it cannot factor in every possible scenario. I cannot tell the future, no one can. I am not making a prediction, do not ask me for one. I do not give financial advice, please don’t ask. I am working on region specific posts to go more into detail how bad this situation will be, because it depends on where you live. I am focusing on the area most at risk first, south east Asia, subsaharan Africa, Latin America. After that I will go on to wealthy Asian countries, Australia, Europe, and the U.S.. Linked below is my previous post. Thank you for reading, and take care.

https://www.reddit.com/r/oil/s/STKrSiDtjW

Sources

The Drive: "Second Automaker Sounds Alarm Over Dwindling Motor Oil Stock [UPDATE]" (May 14, 2026) Nissan bulletin confirmed authentic by Nissan spokesperson, 45% allocation cut at 55% of prior-year volumes, effective May 1, never distributed to dealers
The Drive: "Alleged Toyota Service Bulletin Warns of Looming Motor Oil Shortage" (May 14, 2026) Toyota bulletin unconfirmed by Toyota, substitution guidelines for 0W-8 and 0W-16, not a permanent fix
Carscoops: "AutoZone's Alleged Memo On Motor Oil Supply Is Ugly" (May 15, 2026) leaked memo, 40% supply drop, AutoZone did not respond to request for comment
Shell Plc: "Impact of Middle East conflict on Shell activities" (March 2026) confirms train two damage, ~1 year repair timeline, train one undamaged
Shell.com.qa: "GTL Products" 30,000 bpd base oil capacity, enough for 225 million cars per year
ILMA.org: "GM Responds to ILMA's Dexos Licensing Relief Request" (April 3, 2026) GM refuses enforcement flexibility, Holly Alfano statement
ExxonMobil base stocks FAQ (via The Drive) confirms "synthetic" is a U.S. marketing term, Group III refined from crude oil streams
JobbersWorld: "Group III Tightens as Prices Surge and Supply Constraints Deepen" (March 24, 2026) U.S. Census Bureau / Global Trade Tracker import data, spot availability "largely disappeared"
JobbersWorld: "After the Ceasefire: Hope for Lower Crude, But Group III Relief May Take Much Longer" (April 8, 2026) bifurcated recovery timeline
JobbersWorld: "Where Group III Actually Matters: A Practical Framework for Managing Lubricant Supply Risk" (April 29, 2026) Group III+ low-viscosity products identified as biggest exposure point
Axios: "Motor oil shortages are starting to appear amid Middle East disruptions" (May 15, 2026) ILMA, ICIS comments, Amanda Hay quote (behind Cloudflare, accessed May 16)

Edit: Updated sources with clickable links

Nissan — 45% allocation cut
The Drive, May 14, 2026: "Second Automaker Sounds Alarm Over Dwindling Motor Oil Stock [UPDATE]"
https://www.thedrive.com/news/second-automaker-sounds-alarm-over-dwindling-motor-oil-stock
Nissan bulletin confirmed authentic by Nissan spokesperson. 45% cut, 55% of prior-year volumes. Effective May 1, never distributed to dealers.

Toyota — substitution guidelines (unconfirmed)
The Drive, May 14, 2026: "Alleged Toyota Service Bulletin Warns of Looming Motor Oil Shortage"
https://www.thedrive.com/news/alleged-toyota-dealer-bulletin-warns-of-looming-motor-oil-shortage
Toyota has not confirmed the bulletin. Substitution guidelines for 0W-8 and 0W-16 oils, not a permanent fix.

AutoZone memo (alleged)
Carscoops, May 15, 2026: "AutoZone's Alleged Memo On Motor Oil Supply Is Ugly, And Your Next Oil Change Could Prove It"
https://www.carscoops.com/2026/05/autozone-motor-oil-shortage/
40% supply drop estimate. AutoZone did not respond to request for comment.

Shell Pearl GTL — confirmed damage
Shell Plc, March 2026: "Impact of Middle East conflict on Shell activities"
https://www.shell.com/news-and-insights/newsroom/news-and-media-releases/2026/impact-of-middle-east-conflict-on-shell-activities.html
Train two damaged, ~1 year full repair. Train one undamaged.

Shell.com.qa: "GTL Products"
https://www.shell.com.qa/energy-and-innovation/gtl-products.html
30,000 bpd base oil capacity. Enough for 225 million cars per year.

ILMA / GM dexos fight
ILMA, April 3, 2026: "GM Responds to ILMA's Dexos Licensing Relief Request"
https://ilma.org/gm-responds-to-ilmas-dexos-licensing-relief-request/
GM refuses enforcement flexibility. Holly Alfano statement included.

"Synthetic" is a marketing term
ExxonMobil: Base Stocks FAQ
https://www.exxonmobil.com/en/basestocks/faq-basics
"In the U.S., the government considers 'synthetic' to be a marketing term." Most Group III base stocks are refined from crude oil streams.

Additional context
Axios, May 15, 2026: "Motor oil shortages are starting to appear amid Middle East disruptions"
https://www.axios.com/2026/05/15/motor-oil-shortage-hormuz
ILMA and ICIS comments, Amanda Hay quote.

Wheel Front, May 2026: "Motor Oil Shortage Looms as Second Automaker Braces"
https://wheelfront.com/motor-oil-shortage-looms-as-second-automaker-braces/

Nissan bulletin — additional coverage:
https://www.msn.com/en-us/money/markets/nissan-confirms-45-motor-oil-supply-cut-warning/ss-AA23gNM3

JobbersWorld (industry trade publication, paywalled — no public URLs available)

• "Group III Tightens as Prices Surge and Supply Constraints Deepen" (March 24, 2026) — U.S. Census Bureau / Global Trade Tracker import data, spot availability "largely disappeared"
• "After the Ceasefire: Hope for Lower Crude, But Group III Relief May Take Much Longer" (April 8, 2026) — bifurcated recovery timeline

u/alemorg — 4 days ago
▲ 613 r/oil

Motor Oil Is The Next Shortage And It's Just As Bad As Higher Gas Prices

The crude oil shortage is the main headline. Gasoline, diesel, jet fuel. But there is a downstream supply chain that is about to hit most car owners in the world.

The AutoZone Memo

A leaked internal AutoZone memo is circulating, warning that the U.S. is facing "the largest supply shortage of lubricating fluids in the modern history of America" with "average available supply in this product category to drop by 40%."

Is the memo authentic? AutoZone corporate has not confirmed it. Carscoops reached out and received no reply as of May 15. But the data inside it is consistent with what multiple independent sources are reporting: JobbersWorld (the lubricant industry's primary trade publication), the Independent Lubricant Manufacturers Association (ILMA), ICIS, Shell's own public statements, and confirmed internal memos from Nissan and Toyota.

Nissan: 45% Allocation Cut, Confirmed

Nissan drafted an internal bulletin obtained by The Drive and confirmed as authentic by a Nissan spokesperson. The bulletin laid out a hard number: allocation of Nissan Genuine Oil (including Mobil and Mobil 1 variants) capped at 55% of prior-year volumes. A 45% cut. Effective May 1, 2026.

The bulletin includes draft customer talking points. The "why" section states the shortage affects all automakers, not just Nissan. From The Drive's reporting, the full text reads:

"We are writing to provide an important update regarding the availability of engine oil products across the Nissan network in the U.S. Due to ongoing global supply constraints impacting key raw materials and refining inputs due to the Middle East Conflict, we have been advised of reduced production capacity for most lubricant products. As a result, Nissan will be implementing the following adjustments, effective May 1, 2026. Allocation of Nissan Genuine Oil (including Mobil and Mobil 1 variants) will be constrained and managed at a 55% YoY level based on gallons purchased."

The Nissan spokesperson told The Drive that while the bulletin is real, it was never distributed to Nissan's dealer network. The May 1 effective date has come and gone without the memo being sent.

Source: The Drive, "Second Automaker Sounds Alarm Over Dwindling Motor Oil Stock [UPDATE]" (May 14, 2026)

Toyota: Substitution Guidelines, Unconfirmed

The Drive reported on May 14 that Toyota may have sent a service bulletin warning of a shortage of 0W-8 and 0W-16 oils. The bulletin, allegedly from Toyota and its supplier ExxonMobil, instructs dealers to use substitution guidelines, substituting heavier oil weights one day per week for 0W-8 and one day every other week for 0W-16.

Toyota has not confirmed the bulletin's authenticity. The Drive reached out to a Toyota spokesperson; as of publication time, Toyota had not responded. Based on comparisons to other known Toyota bulletins, The Drive assessed the document appears genuine. The substitutions are allowed for one service interval only, not a permanent fix.

Two of the world's largest automakers drafting rationing plans within days of each other is not a coincidence. It is a supply chain signal.

Source: The Drive, "Alleged Toyota Service Bulletin Warns of Looming Motor Oil Shortage" (May 14, 2026)

Why Motor Oil Specifically?

Motor oil is not pumped out of the ground and poured into a bottle. Modern synthetic passenger car motor oils (the kind required by nearly every car built in the last 15 years) require high purity Group III base oils. Group III base oils are the raw ingredient that makes synthetic oil synthetic.

The United States is a net importer of Group III base oils. Domestic production covers only 30% to 50% of demand.

JobbersWorld reported in March 2026, using U.S. Census Bureau and Global Trade Tracker data, that Middle Eastern sources (primarily Qatar, the UAE, and Bahrain) supplied more than 40% of total U.S. Group III supply for three consecutive years. In January 2026, that share climbed to approximately 55%.

Virtually all of these volumes must physically transit the Strait of Hormuz. The Strait has been functionally closed to commercial transit since February 28.

The AutoZone memo's 40% figure is not an estimate. It is a direct reflection of losing the specific import channel the U.S. depends on for modern synthetic oil.

The Pearl GTL Strike

Shell's Pearl gas to liquids (GTL) plant in Qatar's Ras Laffan Industrial City was struck by Iranian missiles on March 19, 2026. Shell confirmed the damage in a public statement: "no damage to train one and an initial assessment of around one year for full repair of train two."

Pearl GTL is one of the world's largest sources of premium Group III+ base oils, with the capacity to produce about 30,000 barrels of base oil per day, enough to fill 225 million cars per year, according to Shell's own website. One of two production trains was damaged. Shell's own estimate: approximately one year for full repair.

This is the plant that produces the base oil for Pennzoil's synthetic line made from natural gas. It produces base oil for Mobil 1 formulations. It is offline, and it is not coming back until mid-2027 at best.

Sources: Shell Plc public statement (March 2026); shell.com.qa, "GTL Products"

What "Synthetic" Actually Means

A dirty secret of the motor oil industry: in the United States, "synthetic" is a marketing term, not a chemical classification. Most oils sold as "full synthetic" are Group III base stocks refined from crude oil. ExxonMobil itself states: "There is no generally accepted definition of a synthetic base stock, or synthetic base oil. In the U.S., the government considers 'synthetic' to be a marketing term." And: "Most Group III base stocks are refined from crude oil streams."

This matters because if your car requires synthetic oil (and most modern turbocharged engines do), you cannot just substitute conventional. And the crude refining chain that produces Group III base oils is the same chain being squeezed by the Strait of Hormuz closure.

Not all Group III is interchangeable either. Group III+ grades used in 0W-20 and 0W-16 formulations (the weights specified by most new cars) have even fewer alternative sources. JobbersWorld's April 29 analysis identified these low-viscosity products as the single biggest point of exposure.

Source: ExxonMobil base stocks FAQ (via The Drive, May 14, 2026)

The ILMA / GM Dexos Fight

The Independent Lubricant Manufacturers Association formally requested that General Motors grant temporary flexibility under its dexos engine oil licensing program so blenders could use alternative base oils during the shortage. GM refused.

GM's position: no enforcement pause. License terminations will continue. Blenders have approximately one month of forward inventory. After that, companies without approved alternatives face "serious commercial and licensing risk, including potential termination."

Translation: the blenders who make the oil that goes into GM vehicles are being told by GM that if they cannot source Group III base oil to the exact dexos specification, they lose their license and cannot sell dexos-approved oil. Meanwhile, the Group III base oil physically does not exist on the spot market.

ILMA CEO Holly Alfano, from the ILMA website (April 3, 2026): "ILMA appreciates GM's response; however, we remain concerned by the OEM's decision not to provide temporary enforcement flexibility under these extraordinary circumstances."

Source: ILMA.org, "GM Responds to ILMA's Dexos Licensing Relief Request" (April 3, 2026)

Current Market Conditions

From JobbersWorld, March 24, 2026, and confirmed by Axios on May 15, 2026:

Spot availability for Group III base oils has "largely disappeared." Unless you have strong existing supply contracts, "you're not going to find it." Prices are escalating in what blenders describe as an "unstructured, less predictable manner." Some estimates put Group III prices approaching $2.00 per gallon above pre-crisis levels.

ICIS global lead for base oils Amanda Hay, speaking to Axios on May 15: "Actual shortages are starting to appear" for some synthetic oil products. "Security of supply is the chief concern for industry players."

Note: JobbersWorld is behind a paywall and cannot be independently accessed without a subscription. The Axios quotes were accessed on May 16, 2026 but cannot be re-verified in real time.

The Timeline: Worse Than Crude

Here is the critical distinction most people miss. Crude oil is a commodity. Group III base oils are a specialty refined product from specific plants.

JobbersWorld's April 8 analysis: even if the Strait of Hormuz reopens tomorrow, Group III relief "may take much longer" than crude relief. The market will bifurcate. Group I and II (conventional oils, industrial lubricants) will see faster relief. Group III and Group III+ will remain tight and expensive for months after any geopolitical resolution.

Why? Because Pearl GTL is physically damaged and takes a year to repair. Because supply chains for specialty base oils do not just snap back when tankers start moving again. Because blenders carrying one month of inventory will take months to restock the entire distribution chain.

The lubricant industry's traditional pricing playbook, built around predictable cost adjustments and long lag times, has broken. The market has shifted to what blenders describe as an "all-in" approach where simply securing supply is the dominant factor. Price is secondary.

What This Means For You

If you drive a modern car that requires synthetic oil (basically anything with a turbo, direct injection, or a 0W viscosity rating), here is where this lands:

Your next oil change is going to cost more. Possibly a lot more.
Your dealer or independent shop may not have your exact oil weight in stock. They may offer you an alternative that "meets spec" but was not what your engine was designed for.
If you are due for an oil change in the next month or two, do it now. The supply has not collapsed yet, but two automakers and the largest auto parts retailer in America are clearly preparing for exactly that.
This is not a "gas prices are high" problem. Gas prices can spike and then come back. Motor oil is a manufactured product from damaged and offline facilities with no short-term replacement. The timeline is months, not weeks.

Personal Note: First off I like to thank everyone for their comments made on my last oil post. This is a shortened post, it cannot factor in every possible scenario. I cannot tell the future, no one can. I am not making a prediction, do not ask me for one. I do not give financial advice, please don’t ask. I am working on region specific posts to go more into detail how bad this situation will be, because it depends on where you live. I am focusing on the area most at risk first, south east Asia, subsaharan Africa, Latin America. After that I will go on to wealthy Asian countries, Australia, Europe, and the U.S.. This particular post is focused on America due to the access of news sources available to me. Linked below is my previous post.

Thank you for reading, and take care.

https://www.reddit.com/r/oil/s/STKrSiDtjW

Sources

The Drive: "Second Automaker Sounds Alarm Over Dwindling Motor Oil Stock [UPDATE]" (May 14, 2026) Nissan bulletin confirmed authentic by Nissan spokesperson, 45% allocation cut at 55% of prior-year volumes, effective May 1, never distributed to dealers
The Drive: "Alleged Toyota Service Bulletin Warns of Looming Motor Oil Shortage" (May 14, 2026) Toyota bulletin unconfirmed by Toyota, substitution guidelines for 0W-8 and 0W-16, not a permanent fix
Carscoops: "AutoZone's Alleged Memo On Motor Oil Supply Is Ugly" (May 15, 2026) leaked memo, 40% supply drop, AutoZone did not respond to request for comment
Shell Plc: "Impact of Middle East conflict on Shell activities" (March 2026) confirms train two damage, ~1 year repair timeline, train one undamaged
Shell.com.qa: "GTL Products" 30,000 bpd base oil capacity, enough for 225 million cars per year
ILMA.org: "GM Responds to ILMA's Dexos Licensing Relief Request" (April 3, 2026) GM refuses enforcement flexibility, Holly Alfano statement
ExxonMobil base stocks FAQ (via The Drive) confirms "synthetic" is a U.S. marketing term, Group III refined from crude oil streams
JobbersWorld: "Group III Tightens as Prices Surge and Supply Constraints Deepen" (March 24, 2026) U.S. Census Bureau / Global Trade Tracker import data, spot availability "largely disappeared"
JobbersWorld: "After the Ceasefire: Hope for Lower Crude, But Group III Relief May Take Much Longer" (April 8, 2026) bifurcated recovery timeline
JobbersWorld: "Where Group III Actually Matters: A Practical Framework for Managing Lubricant Supply Risk" (April 29, 2026) Group III+ low-viscosity products identified as biggest exposure point
Axios: "Motor oil shortages are starting to appear amid Middle East disruptions" (May 15, 2026) ILMA, ICIS comments, Amanda Hay quote (behind Cloudflare, accessed May 16)

Edit2: Sources with clickable links

Nissan: 45% allocation cut
The Drive, May 14, 2026: "Second Automaker Sounds Alarm Over Dwindling Motor Oil Stock [UPDATE]"
https://www.thedrive.com/news/second-automaker-sounds-alarm-over-dwindling-motor-oil-stock
Nissan bulletin confirmed authentic by Nissan spokesperson. 45% cut, 55% of prior-year volumes. Effective May 1, never distributed to dealers.

Toyota: substitution guidelines (unconfirmed)
The Drive, May 14, 2026: "Alleged Toyota Service Bulletin Warns of Looming Motor Oil Shortage"
https://www.thedrive.com/news/alleged-toyota-dealer-bulletin-warns-of-looming-motor-oil-shortage
Toyota has not confirmed the bulletin. Substitution guidelines for 0W-8 and 0W-16 oils, not a permanent fix.

AutoZone memo (alleged)
Carscoops, May 15, 2026: "AutoZone's Alleged Memo On Motor Oil Supply Is Ugly, And Your Next Oil Change Could Prove It"
https://www.carscoops.com/2026/05/autozone-motor-oil-shortage/
40% supply drop estimate. AutoZone did not respond to request for comment.

Shell Pearl GTL : confirmed damage
Shell Plc, March 2026: "Impact of Middle East conflict on Shell activities"
https://www.shell.com/news-and-insights/newsroom/news-and-media-releases/2026/impact-of-middle-east-conflict-on-shell-activities.html
Train two damaged, ~1 year full repair. Train one undamaged.

Shell.com.qa: "GTL Products"
https://www.shell.com.qa/energy-and-innovation/gtl-products.html
30,000 bpd base oil capacity. Enough for 225 million cars per year.

ILMA / GM dexos fight
ILMA, April 3, 2026: "GM Responds to ILMA's Dexos Licensing Relief Request"
https://ilma.org/gm-responds-to-ilmas-dexos-licensing-relief-request/
GM refuses enforcement flexibility. Holly Alfano statement included.

"Synthetic" is a marketing term
ExxonMobil: Base Stocks FAQ
https://www.exxonmobil.com/en/basestocks/faq-basics
"In the U.S., the government considers 'synthetic' to be a marketing term." Most Group III base stocks are refined from crude oil streams.

Additional context
Axios, May 15, 2026: "Motor oil shortages are starting to appear amid Middle East disruptions"
https://www.axios.com/2026/05/15/motor-oil-shortage-hormuz
ILMA and ICIS comments, Amanda Hay quote.

Wheel Front, May 2026: "Motor Oil Shortage Looms as Second Automaker Braces"
https://wheelfront.com/motor-oil-shortage-looms-as-second-automaker-braces/

Nissan bulletin : additional coverage:
https://www.msn.com/en-us/money/markets/nissan-confirms-45-motor-oil-supply-cut-warning/ss-AA23gNM3

JobbersWorld (industry trade publication, paywalled : no public URLs available)

• "Group III Tightens as Prices Surge and Supply Constraints Deepen" (March 24, 2026) U.S. Census Bureau / Global Trade Tracker import data, spot availability "largely disappeared"
• "After the Ceasefire: Hope for Lower Crude, But Group III Relief May Take Much Longer" (April 8, 2026) bifurcated recovery timeline

u/alemorg — 4 days ago
▲ 256 r/investing

The current unemployment rate is misleading. Temp help employment is down 21.4%. This signal has preceded every US recession since 1990. Here is what the data actually shows.

TLDR and Sources at the End

The headline U-3 unemployment rate is 4.3% as of April 2026 (FRED: UNRATE), and most financial headlines call it a "strong labor market." It is not. The number is technically accurate but economically misleading in ways that matter for policy, markets, and anyone trying to figure out where we actually are in the cycle.

This post breaks down what U-3 misses, why the current distortions are severe, and what to look at instead.

HOW U-3 ACTUALLY WORKS

To be counted as unemployed in U-3, you must meet three conditions simultaneously: you do not have a job, you have actively looked for work in the past 4 weeks, and you are available to start a job.

If you stop looking (because you are discouraged, or went back to school, or are driving rideshare to make rent), you are removed from both the numerator and the denominator. You cease to exist in the statistic.

The BLS also publishes U-6, which includes discouraged workers, marginally attached workers, and involuntary part-time workers (people who want full-time work but can only find part-time). U-6 currently sits at 8.2% (FRED: U6RATE, April 2026), nearly double the U-3 figure. The gap between U-3 and U-6 has widened to 3.9 percentage points. A widening U-3 to U-6 spread is a classic late-cycle signal: employers cut hours and shift workers to part-time before they start cutting headcount outright.
Note: the gap was wider during the 2008-2009 crisis (over 7 points) and briefly during COVID. The current 3.9 point gap is elevated relative to mid-cycle norms, not an all-time extreme.

This design limitation has always existed. In normal times the gap between U-3 and economic reality is modest. Right now it is not.

WHY THIS CYCLE IS WORSE

Several factors are artificially compressing the headline number beyond what the standard U-3 limitation would produce:

  1. The temp help collapse

Temporary help employment (FRED: TEMPHELPS) peaked at 3,161,400 in March 2022 and has fallen to 2,485,100 as of April 2026. That is a decline of 676,300 jobs, or 21.4 percent.

Temp help is widely considered among the best leading indicators of recession by economic researchers. It peaks 6 to 18 months before every downturn because businesses cut temps first, then part-timers, then full-timers. The current decline has been underway for over two years and has not reversed.

For context: during the 2008 financial crisis, temp help fell 33.9 percent from peak (May 2006: 2,654.3K) to trough (June 2009: 1,753.8K). The current decline is about two-thirds of that magnitude. (Source: FRED TEMPHELPS, author calculation.) This is a red signal that the headline unemployment rate completely misses.

Also, many former temp workers do not show up as "unemployed" in U-3. They drift into gig work or drop out of the labor force entirely. The temp collapse signals real labor market deterioration that U-3 masks by design.

  1. Labor force shrinkage

When people leave the labor force entirely, they are no longer counted in the unemployment rate. Since January 2025, immigration enforcement has removed a significant number of people from the BLS survey frame. DHS reports more than 675,000 formal deportations in President Trump's first year, plus an estimated 2.2 million self-deportations, totaling nearly 3 million people who left the country (DHS press release, January 20, 2026). The lower-bound ICE-only formal removal count is 442,637 for fiscal year 2025 per ICE data reported by Axios (April 2026).

Important disclaimer on these numbers: independent trackers show substantially lower figures. TRAC at Syracuse University reports 290,603 formal ICE removals from January 2025 through November 2025, only 7 percent above FY2024 levels under Biden. The DHS self-deportation estimate of 2.2 million cannot be independently verified and the methodology for it has not been publicly disclosed. The true labor force impact from immigration enforcement is somewhere in this wide range, and readers should treat all figures as disputed.

This mechanically lowers the unemployment rate because a shrinking labor force denominator masks any simultaneous layoffs. If you remove people from the labor force, unemployment falls even if zero new jobs are created. This is arithmetic, not politics.

The exact impact on U-3 is impossible to calculate because we do not know the employment status of every person who left. But the direction is unambiguous: hundreds of thousands of working-age adults have exited the survey frame. That compresses the unemployment rate independently of actual labor market health.

The overall labor force participation rate sits at 67.0 percent (FRED: LNS11300001, April 2026). The prime-age (25-54) participation rate is 83.8 percent (FRED: LNS11300060), which appears healthy. But the composition underneath matters: the participation rate is propped up by women and older workers staying in the workforce longer, often out of financial necessity rather than genuine labor demand. This masks softening at the margins where recessions start.

  1. The gig economy classification problem

Millions of drivers, delivery workers, and freelancers count as "employed" in the BLS household survey even when their net earnings fall below minimum wage after expenses. The BLS does not capture declining hourly earnings among the self-employed in the unemployment rate.

You can drive 50 hours a week for a rideshare platform, net well under minimum wage after gas and vehicle costs, and you are "employed" under U-3. The quality of employment has deteriorated in ways the headline number cannot detect.

  1. The quits rate has collapsed

The JOLTS quits rate (FRED: JTSQUR) peaked at 3.0 percent in November 2021 and has fallen to 2.0 percent as of March 2026. People do not voluntarily leave jobs when they cannot find better ones. A falling quits rate signals low labor market confidence, but it does not affect the unemployment rate at all.

This is one of the cleanest tells: a healthy labor market has churn. Workers leave for better pay. A scared labor market has people clinging to whatever they have. The quits rate is telling you the latter.

  1. Real wages are under pressure for most people

Average hourly earnings for all private employees grew from $36.12 in April 2025 to $37.41 in April 2026, a nominal gain of 3.6 percent (FRED: CES0500000003). That sounds adequate until you adjust for actual inflation faced by the bottom 60 percent of earners. The CPI basket weighting understates housing and food costs for lower-income households, meaning real wage growth for most workers is flat to slightly negative. People are employed but not gaining ground. This is a labor market quality signal U-3 cannot capture.

Disclaimer: real wage analysis depends heavily on which inflation measure you use. By headline CPI, workers may show modest real gains. By a bottom-60-percent weighted basket, the picture is worse. There is no single definitively correct measure.

  1. The personal saving rate has cratered

The personal saving rate (FRED: PSAVERT) has fallen to 3.6 percent as of March 2026. This is down from 4.5 percent in January 2026 and well below the long-term average. Consumers have exhausted pandemic-era savings and are now running on fumes.

Combined with $5.14 trillion in consumer credit outstanding (FRED: TOTALSL, March 2026), households have very little buffer. A labor shock would cascade quickly into defaults.

note on credit card delinquencies: the rate has actually declined from its 3.22 percent peak in Q2 2024 to 2.94 percent in Q4 2025 (FRED: DRCCLACBS, latest available). This is an improving trend, not a deteriorating one. However, 2.94 percent remains elevated compared to the 1.53 percent COVID-era low in 2021 and is in line with 2019 pre-pandemic levels. Credit card stress has not gotten worse recently, but it has not normalized either. This indicator is not flashing red right now, but the savings buffer is so thin that any deterioration here would hit fast.

WHY THIS MATTERS

Politicians and media report U-3 as "the unemployment rate" without qualification. The Federal Reserve uses it as a primary input for rate decisions. Markets price off it. The average person hears "4.3 percent unemployment" and assumes the labor market is healthy.

The gap between U-3 and lived economic reality has widened over time because the economy has changed in ways the BLS methodology from the 1940s was never designed to capture. The gig economy did not exist at scale 20 years ago. Labor force participation has structurally declined since 2000. The divergence between asset-owners and wage-earners has never been wider. Mass immigration enforcement at current scale is a new variable without precedent in BLS methodology.

U-3 worked reasonably well as a summary statistic in 1985 when most workers had traditional employment and the gig economy did not exist. In 2026, it is a rearview mirror with half the glass painted over.

Federal Reserve policy. The Fed targets maximum employment as half of its dual mandate. If the Fed looks at 4.3 percent U-3 and concludes the labor market is tight, it keeps rates restrictive for longer, punishing the very workers whose actual employment situation is far more precarious than the headline number suggests. Cutting rates too late because you are looking at the wrong labor market gauge deepens and extends recessions. The yield curve (FRED: T10Y2Y) has recently uninverted to +0.48 percent as of May 13, 2026. Historically, the curve often uninverts shortly before or around the time recessions begin, because short-term rates get cut in response to weakening conditions. The uninversion does not mean the danger has passed; it typically means the recession window is now open, not closed.

WHAT THE REAL UNEMPLOYMENT RATE PROBABLY IS

If you adjust for labor force shrinkage from deportations and discouraged workers, involuntary part-time workers who want full-time work, gig workers earning sub-poverty wages but counted as employed, and the structural participation rate decline, the actual real-feel unemployment and underemployment rate is likely in the 7 to 9 percent range, not 4.3 percent.

This is not a precise calculation. It is a ballpark estimate with the known gaps: the U-6 to U-3 spread of 3.9 points, the temp help decline of 21.4 percent, the quits rate collapse, and the savings depletion all point in the same direction. Reasonable people can argue for a range of 6 to 10 percent depending on what adjustments they consider valid. The core point is that the economy is likely weaker than the 4.3 percent headline suggests.

WHAT TO LOOK AT INSTEAD

If you want an honest read on the US labor market, here is what actually matters, ranked by signal quality:

  1. Temp Help Employment (FRED: TEMPHELPS).

Widely considered one of the best leading indicators. Peaked March 2022 at 3,161.4K. Currently at 2,485.1K. Down 21.4 percent and still falling.

  1. U-6 Unemployment Rate (FRED: U6RATE). Includes discouraged, marginally attached, and involuntary part-time workers. Currently at 8.2 percent. When U-6 diverges from U-3, it signals deterioration at the margins, the exact places where recessions start.

  2. Quits Rate (FRED: JTSQUR). Fallen from 3.0 percent to 2.0 percent. A confident labor market has people voluntarily leaving jobs for better ones. A scared labor market has people clinging to whatever they have.

  3. Initial Jobless Claims (FRED: ICSA). Currently at 211,000 (May 9, 2026), which is low and not yet flashing. Watch for a sustained move above 300,000. This indicator turns late but hard.

  4. Personal Saving Rate (FRED: PSAVERT). At 3.6 percent and falling. Shows consumer resilience or lack thereof. When this is low, any income disruption goes straight to defaults.

  5. Credit Card Delinquency Rate (FRED: DRCCLACBS). At 2.94 percent as of Q4 2025. This has actually declined modestly from its 3.22 percent peak in Q2 2024. The trajectory is improving, not worsening. That said, 2.94 percent is roughly double the 1.53 percent COVID-era low and in line with 2019 levels. This indicator is neutral right now. Not flashing red, but not at levels that signal a healthy consumer either. Quarterly data, lags by 6 months.

Disclaimer: This is economic analysis, not financial advice. Not every indicator in this post is flashing recession. Initial jobless claims are low at 211K. Credit card delinquencies have actually declined for five straight quarters. The prime age participation rate is historically solid at 83.8 percent. The DHS deportation numbers are disputed by independent trackers. The gig economy classification issue reflects a BLS measurement gap, not a failure of this analysis: the BLS does not ask gig workers whether they would prefer traditional employment, and no admin data tracks this. Several points go both ways, and I try to account for that honestly. The thesis is not that everything is terrible. It is that the headline U-3 paints an incomplete picture and the data underneath shows deterioration.

TLDR: The 4.3 percent unemployment rate is technically accurate but economically misleading. Temp help employment is down 21.4 percent from its March 2022 peak, a decline of two-thirds the magnitude of 2008 and the strongest recession warning among leading indicators. DHS reports more than 675,000 formal deportations and an estimated 2.2 million self-deportations since January 2025, artificially compressing the BLS denominator (note: independent trackers show lower figures; these numbers are disputed). Gig workers earning below minimum wage count as employed. The quits rate has collapsed from 3.0 to 2.0 percent. The personal saving rate has cratered to 3.6 percent. U-6 sits at 8.2 percent, nearly double U-3. The real unemployment and underemployment rate is likely 7 to 9 percent. Credit card delinquencies have actually declined from their 2024 peak and initial jobless claims remain low, so not every indicator is flashing. But on balance, the U-3 number tells you very little about actual labor market health in 2026.

Data sources: FRED series UNRATE, U6RATE, TEMPHELPS, JTSQUR, PSAVERT, DRCCLACBS, T10Y2Y, LNS11300001, LNS11300060, ICSA. BLS Current Population Survey. JOLTS. DHS press release January 20 2026. ICE FY2025 removal data via Axios April 15 2026. DeportationData Project (UC Berkeley) March 2026. TRAC Reports (Syracuse University) November 2025. All FRED data accessed and verified May 14 2026.

reddit.com
u/alemorg — 7 days ago
▲ 33 r/fitnessportugal+1 crossposts

Protein Intake for Muscle Gains; An Evidence Based Approach and Review

Simple Summary

A meta-analysis of 49 studies with 1,863 participants shows 1.6 g/kg/day (0.73 g/lb/day) is the point of diminishing returns for muscle gain. For a 180 lb (82 kg) person, that is about 130 grams per day. Beyond this, additional protein has not been shown to increase muscle mass.

Per meal, roughly 0.4 g/kg (0.18 g/lb), about 30-40 grams for most people, across 4 meals gets you to 1.6 g/kg/day. The idea that the body cannot use more than 30 grams of protein per meal is incorrect. It originated from studies using fast-digesting whey in isolation; whole food protein digests over several hours and larger per-meal doses are not wasted.

Protein timing around training has no detectable effect on muscle growth when total daily intake is adequate. Two meta-analyses and a direct trial support this.

Plant protein produces equivalent results to animal protein when total intake is matched.

During a caloric deficit, evidence is weaker but suggests 2.0-2.5 g/kg/day (0.91-1.14 g/lb/day) may help preserve lean mass.

Things the evidence does not support: BCAA or leucine supplementation beyond what adequate total protein provides, precise peri-workout timing windows, or any hard cap on protein utilization per meal from whole foods.

A Deep Dive into the Data (The summary above explains everything below)

1: THE GOLD STANDARD

Morton et al 2018 (PMID 28698222): Published in British Journal of Sports Medicine. Systematic review, meta-analysis, and meta-regression of 49 RCTs, n = 1,863. The definitive paper on this question.

Key finding: Protein supplementation significantly increased fat-free mass by 0.30 kg (0.66 lb; 95% CI 0.09 to 0.52 kg, p < 0.05). The meta-regression showed a ceiling: FFM gains increased with protein intake up to approximately 1.62 g/kg/day (0.73 g/lb/day), after which no further benefit was observed. The slope flattened to near zero. Additional findings: benefit of supplementation on FFM declined with age (-0.01 kg/yr [-0.022 lb/yr], p = 0.002) and was larger in trained individuals (0.75 kg [1.65 lb], p = 0.03).

What this means: At 1.6 g/kg/day you capture essentially all the muscle-building benefit protein can provide. The 0.30 kg average effect includes studies where baseline protein was already adequate; effects were larger when baseline intake was low.

Study design: Tier 5 (meta-analysis with meta-regression). Allows seeing the dose-response shape rather than just a binary yes/no. Limitations: dietary intake was self-reported in most trials; most studies were 6-12 weeks. Author SMP has received funding from the US National Dairy Council.

Jäger et al, ISSN Position Stand 2017 (PMID 28642676): Published in JISSN. Official ISSN position after comprehensive review. Recommendations: 1.4-2.0 g/kg/day (0.64-0.91 g/lb/day) for building muscle; 2.3-3.1 g/kg/day (1.04-1.41 g/lb/day) during hypocaloric periods. Per-meal: 0.25-0.40 g/kg (0.11-0.18 g/lb), or 20-40g absolute. Total daily intake dominates over timing. The ISSN range brackets Morton's 1.6 g/kg almost perfectly, giving us two independent sources converging on the same number.

Study design: Tier 9 (expert position stand). Industry-adjacent (supplement companies sponsor ISSN conferences), but recommendations are conservative and align with the independent Morton MA.

2: PER-MEAL DOSING

Schoenfeld and Aragon 2018 (PMID 29497353): Published in JISSN. Narrative review that directly addressed the "you can only absorb 20-30g per meal" claim. MPS is maximized at roughly 0.24-0.40 g/kg/meal (0.11-0.18 g/lb), or 20-35g for an 80 kg (176 lb) person. But whole-food protein digests over 3-6 hours, not 90 minutes like isolated whey. A 50g protein meal from steak is not wasted. Recommendation: 0.4 g/kg/meal across 4 meals to reach 1.6 g/kg/day. For 80 kg (176 lb): 32g x 4 meals.

Layman et al 2015 (PMID 25926513): Published in American Journal of Clinical Nutrition. Established the metabolic framework: the per-meal anabolic threshold is roughly 30g of high-quality protein containing 2.5-3g of leucine, the primary mTORC1 trigger. Animal proteins hit this threshold at lower total grams than most plant proteins, which is why protein quality matters, not a reason to supplement free leucine.

Wilkinson et al 2023 (PMID 37537134): Published in Physiological Reports. Systematic review. No significant association between leucine dose and post-exercise MPS rates when total protein was 20g or more. Once you eat enough total protein, leucine takes care of itself. Free leucine or BCAA supplementation on top of adequate protein provides no additional benefit.

3: DOES TIMING MATTER?

Schoenfeld, Aragon, and Krieger 2013 (PMID 24299050): Published in JISSN. Meta-analysis: 478 subjects and 96 effect sizes (strength), 525 subjects and 132 effect sizes (hypertrophy). When controlling for total protein intake, no significant effect of timing on strength or hypertrophy. Total protein intake was the strongest predictor of effect size. The "anabolic window" is a marketing invention. Having protein within 2-3 hours post-exercise is reasonable; urgency is not.

Schoenfeld et al 2017 (PMID 28070459): Published in PeerJ. RCT, n = 21 trained men, 10 weeks. 25g protein immediately pre vs post exercise. No significant differences in any measure of strength, hypertrophy (ultrasound), or body composition. The exact minute does not matter. Study design: small RCT, underpowered, but null result is consistent with the meta-analysis.

4: PRE-SLEEP PROTEIN

Kouw et al 2017 (PMID 28855419): Published in Journal of Nutrition. Double-blind RCT, n = 48 healthy older men (mean age ~72). 40g casein before sleep increased overnight MPS versus placebo. Protein is effectively digested and used during sleep. Most relevant for older adults with anabolic resistance.

Trommelen et al 2023 (PMID 36857005): Published in Sports Medicine. RCT, n = 36 young men. Pre-sleep casein increased both myofibrillar and mitochondrial protein synthesis during overnight recovery. Confirms the strategy works in young populations too.

What this means: Pre-sleep protein works mechanistically, but no long-term training study has shown it adds hypertrophy beyond an already-adequate 1.6 g/kg/day total intake. It is a tool for those struggling to hit their daily target, not a requirement.

5: HOW HIGH IS TOO HIGH?

Antonio et al 2015 (PMID 26500462): Published in JISSN. RCT, n = 48 trained men and women. Compared 3.4 g/kg/day (1.54 g/lb/day) vs 2.3 g/kg/day (1.04 g/lb/day) with heavy resistance training.

Key finding: Both groups gained identical FFM: +1.5 kg (+3.3 lb) in both groups (mean ± SD: +1.5 ± 1.8 kg NP, +1.5 ± 2.2 kg HP; non-significant group difference). The HP group lost more fat (-1.7 kg [-3.7 lb] vs -0.3 kg [-0.66 lb]) and body fat percentage (-2.4% vs -0.7%). Strength gains were equal. Eating 1.1 g/kg/day more protein added zero additional muscle. Both intakes are above Morton's plateau, confirming the ceiling is real.

Bagheri et al 2024 (PMID 39206316): Published in Frontiers in Nutrition. RCT, n = 48 trained young men, 16 weeks. 1.6 vs 3.2 g/kg/day (0.73 vs 1.45 g/lb/day). No significant additional benefit of doubling the dose for lean mass, strength, endurance, or power. Replicated Antonio and Morton with longer duration and direct dose comparison.

Limitations for both: n = 48 underpowered for small effects. A 0.1 kg (0.22 lb) benefit over 16 weeks would be undetectable, but an effect that small is practically irrelevant.

Anyone claiming 1g per pound (2.2 g/kg/day) is already above the evidence-based ceiling. 1.5g per pound (3.3 g/kg/day) is bro-science.

6: DISTRIBUTION AND PROTEIN SOURCE

Tavares et al 2025 (PMID 40673785): Published in Journal of Sports Medicine and Physical Fitness. RCT, 8 weeks. Protein distribution pattern did not significantly affect lean mass or strength gains when total intake was adequate. You do not need exactly 4, 5, or 6 meals; 3-4 protein-containing meals across the day is sensible, but total daily dose dominates.

Hindermann Santini et al 2025 (PMID 41059835): Published in JISSN. RCT. Animal vs plant protein blends produced similar effects on strength and hypertrophy when total protein was matched. Plant protein is not inferior for muscle building with adequate total intake. Also supported by Goldman et al 2024 (PMID 38674813), a modeling study in Nutrients showing plant-based diets meeting energy requirements can supply enough protein and leucine for maximizing hypertrophy.

7: THE RDA IS TOO LOW

Tagawa et al 2025 (PMID 40914512): Published in Journal of Nutrition. Umbrella review: 43 NB articles (777 participants) vs 17 IAAO articles (186 participants). Pre-registered PROSPERO CRD42025636735.

Key finding: IAAO mean was 0.88 g/kg/day (0.40 g/lb/day; 95% CI 0.85 to 0.90) vs NB mean 0.64 g/kg/day (0.29 g/lb/day; 95% CI 0.61 to 0.68) for nonathletes, 36% higher. For athletes: IAAO 1.61 (0.73 g/lb/day; 95% CI 1.44 to 1.78) vs NB 1.27 (0.58 g/lb/day; 95% CI 1.06 to 1.47), 27% higher. Overall ~30% higher by IAAO.

The RDA of 0.8 g/kg/day (0.36 g/lb/day) was built on nitrogen balance, which this review shows systematically underestimates requirements. Applying the RDA safety margin (97.5th percentile) to the IAAO mean produces roughly 1.0-1.1 g/kg/day (0.45-0.50 g/lb/day) for the general population. Even sedentary adults likely need more than the current RDA. Athletes need substantially more, consistent with ISSN and Morton. Tier 2 evidence. Limitation: IAAO literature is small (186 participants vs 777 for NB); co-authors from Meiji Co Ltd (dairy company) disclose employment.

8: EVIDENCE GAPS

Caloric deficit data is thin. The ISSN's 2.3-3.1 g/kg/day cutting recommendation derives from a handful of small studies. Optimum intake during a cut is less certain than for maintenance or surplus.

Older adults may need more per meal (0.4-0.6 g/kg [0.18-0.27 g/lb] vs 0.25-0.4 [0.11-0.18] for young adults) due to anabolic resistance, but long-term hypertrophy trials in older populations are lacking.

Women are underrepresented. Most dosing studies used male participants; direct dose-response data in women is scarce.

No data beyond 16 weeks exists. A small benefit of very high protein compounding over years is theoretically possible but unsupported and the burden of proof is on that claim.

Individual variability is real and poorly quantified. 1.6 g/kg/day (0.73 g/lb/day) is a population plateau, not a personalized prescription. If you are gaining at 1.4 g/kg (0.64 g/lb), fine. If plateaued at 1.6, pushing higher is unlikely to fix it.

9: THE BOTTOM LINE

Total daily: 1.6 g/kg/day (0.73 g/lb/day). 2.0 g/kg/day adds negligible benefit. Above 2.3 g/kg/day adds zero benefit in every study that tested it.

Per meal: ~0.4 g/kg (0.18 g/lb) across 3-4 meals. For 80 kg (176 lb): ~32g x 4 meals = 128g total.

Protein quality: any complete source works. Plant protein achieves equivalent results when intake is matched; complementary combinations (pea + rice, soy) compensate for lower per-gram quality.

Timing: secondary. Consume within a few hours of training as habit; do not stress about windows. Pre-sleep protein is a useful tool for those struggling to hit total intake.

Cutting: aim 2.0-2.5 g/kg/day (0.91-1.14 g/lb/day). Evidence is weaker here.

Does not matter: BCAAs, leucine pills, precise 30-60 minute windows, fear of wasting protein above 30g per meal from whole foods, fear that plant protein is inferior when intake is matched.

If someone is selling a supplement, a timing protocol, or a fear of wasted protein, the evidence does not support their product.

10: STATISTICS NOTE

Numbers verified directly against PubMed abstracts:
- Morton 2018: n = 1,863 (49 studies), FFM 0.30 kg (95% CI 0.09 to 0.52), p < 0.05, plateau at ~1.6 g/kg/day, age effect -0.01 kg/yr (p = 0.002), trained benefit 0.75 kg (p = 0.03). Exact CI for plateau point and individual FFM p-value require full-text.
- Schoenfeld 2013: 478 subjects / 96 ESs (strength), 525 / 132 ESs (hypertrophy), null finding when controlling for total protein. Exact ES and p-values require full-text.
- Antonio 2015: n = 48, NP 2.3 vs HP 3.4 g/kg/d, FFM +1.5 kg both groups (non-significant), HP lost more fat (-1.7 vs -0.3 kg) and body fat % (-2.4% vs -0.7%). Duration and kcal difference require full-text.
- Tagawa 2025: 43 NB (777 participants) vs 17 IAAO (186 participants). IAAO nonathlete mean: 0.88 g/kg/d (95% CI 0.85 to 0.90) vs NB 0.64 (95% CI 0.61 to 0.68). Athletes: IAAO 1.61 (1.44 to 1.78) vs NB 1.27 (1.06 to 1.47). ~30% higher overall. PROSPERO CRD42025636735.

Qualitative findings from abstracts (exact statistics require full-text):
- Schoenfeld 2017 (n = 21), Bagheri 2024 (n = 48), Hindermann Santini 2025, Tavares 2025: all reported null results for primary comparisons.
- Wilkinson 2023: null finding on leucine dose-MPS association above 20g protein (no pooled estimate).
- Kouw 2017 (n = 48), Trommelen 2023 (n = 36): positive pre-sleep MPS findings.
- Schoenfeld & Aragon 2018, Layman 2015, Reidy & Rasmussen 2016: narrative reviews, no pooled statistics.

No numbers were fabricated or estimated. All 18 PMIDs verified against PubMed, May 14 2026. Every PMID resolves to correct paper with matching authors, journals, and years.

reddit.com
u/alemorg — 7 days ago
▲ 1.0k r/oil

When Do Oil Shortages Actually Start? A Timeline Based On What The People Closest To The Physical Market Are Saying

The Strait of Hormuz has been blocked since February 28. Roughly 15% of global oil supply is offline. About 1 billion barrels of global inventory have been burned through. The drawdown rate hit 4.8 million barrels per day between March and April, the fastest in recorded history.

But paper oil is at $100 and gas stations mostly still have fuel. So when does this actually hit?

Here is what the analysts, traders, and executives closest to the physical market are saying as of mid May. These are not my predictions.

The Timeline

Late May to Early June (2-4 weeks): The first tank bottoms

Frederic Lasserre, head of research at energy trader Gunvor Group: "Pakistan, Indonesia or the Philippines likely to be the first to face issues with tank bottoms." He warns that if the Strait is not reopened by early June, "some Asian countries will face a macroeconomic shock because of the shortage of gasoil."

Bloomberg reported in the second week of May that fuel stockpiles in Indonesia, Vietnam, and the Philippines "could fall to warning levels within a month." These countries import the vast majority of their oil through Hormuz and have limited strategic reserves.

Some countries already took emergency measures weeks ago. Sri Lanka moved to a four-day workweek in mid March. Pakistan put 50% of government staff on rotating work from home. Bangladesh shuttered fertilizer plants. These are stopgaps, not solutions.

June: European jet fuel hits critical levels

Independently held jet fuel storage in the Amsterdam-Rotterdam-Antwerp hub has fallen by one-third to a six-year low, according to Bloomberg. With peak summer travel season approaching, some analysts forecast kerosene stockpiles could hit critical levels as early as June. Europe's cushion is estimated at roughly one extra month beyond Asia before "the situation becomes difficult to manage" (Lasserre, Gunvor).

June to July: Import-dependent countries face shortages

Chevron CFO Eimear Bonner told Bloomberg TV on May 1: "We are going to start to see some import-dependent countries potentially start to face critical shortages as we get into the June-July time-frame."

Morgan Stanley warned last week that the market is in a "race against time" and that oil prices "could spike sharply if the Strait of Hormuz doesn't reopen until July."

Meanwhile, Japan's oil inventories are down 50% since the conflict started, sitting at seasonal lows not seen in at least a decade (Kayrros). India is down roughly 10%. US distillate stockpiles are at their lowest since 2005. US gasoline inventories are near their lowest seasonal levels since 2014. The US has released 172 million barrels from the Strategic Petroleum Reserve, coordinated with a 400-million-barrel IEA release; it has not been enough to stop the drawdown.

September: The operational floor

Natasha Kaneva, JPMorgan's head of global commodities research, estimates that OECD inventories could reach "operational stress levels" by early June and then the "operational minimum floor" by September if the Strait remains closed.

This is the concept most people miss. The operational floor is not empty tanks. It is the minimum amount of oil needed for pipelines, storage terminals, and refineries to physically function. Below that level, refining stops even if crude technically exists somewhere in the system. You hit this floor months before tanks read zero.

Why Is Oil Still At $100?

Because the market is burning through every buffer simultaneously: China slashed crude imports 20% in April (lowest since COVID lockdowns in 2022). Refiners are cutting runs and drawing down commercial inventories rather than paying up for physical cargoes. Strategic reserves are being released globally. US crude exports are at all-time highs. Market is pricing in TACO.

None of these buffers are permanent. Goldman Sachs noted global visible oil inventories are nearing their lowest since 2018. Ziad Daoud at Bloomberg Economics: "Inventories are finite. Neither governments nor companies can draw them down indefinitely."

The Fertilizer And Food Angle

Fertilizer production requires natural gas, much of which also transits through Hormuz. The UN warned this week that disruptions in the Strait could drive up food and fertilizer costs and worsen global hunger, with 45 million more people at risk. Even if the Strait reopened tomorrow, the damage to 2026 harvests is being locked in now.

S&P 500 Top vs Oil Peak: Historical Lead Times

• 1973-75 Oil Embargo: S&P Jan 1973 → Oil Jan 1974 (+12.0 months later)
• 1980 Iran Revolution: S&P Nov 1979 → Oil Apr 1980 (+4.9 months later)
• 1981-82 Volcker: S&P Jun 1981 → Oil May 1982 (+11.0 months later)
• 1990-91 Gulf War: S&P Jul 1990 → Oil Oct 1990 (+3.0 months later)
• 2001 Tech Bust: S&P Mar 2000 → Oil Nov 2000 (+8.0 months later)
• 2008 Financial Crisis: S&P Oct 2007 → Oil Jun 2008 (+8.0 months later)
• 2022 Bear Market: S&P Jan 2022 → Oil Jun 2022 (+4.9 months later)
• 2020 COVID (exception): S&P Feb 2020 ← Oil Jan 2020 (1.0 month earlier)

What this means: In every major oil crisis since 1970, the S&P 500 peaked before oil peaked. The market started selling off while oil was still rising. Once oil finally topped, the market was already well into a decline. The average lead time is about 200 days. The shortest was 90 days (1990 Gulf War). The longest was a full year (1973 embargo).

If this pattern repeats, we have not even seen the oil peak yet, and the stock market top is still ahead of us. The current setup (S&P at all-time highs, oil drifting near $100 as 15% of global supply is blocked) looks nothing like any historical precedent.

I do have to add that I think the only reason oil is not higher, is because trump keeps pumping out headlines about peace deals etc. The market is pricing in TACO when this isn’t something you can back out from anymore. Oil was higher in 2022 and there was no shortage like there is today. So historical comparisons probably won’t match up to today as it normally should.

Disclaimer

These are estimates from analysts at major banks, trading desks, and energy companies. They are making their best projections based on available inventory data and known supply flows. They can be wrong. SocGen estimated in March that some countries had roughly 30 days of cover; those countries did not run dry by mid-April, because demand destruction and alternate supply filled part of the gap. The system adapts. That said, the direction and magnitude of the May estimates are consistent across multiple independent sources. The window they all point to is weeks, not months.

Sources

• Fortune / Bloomberg: "Iran war is draining world's oil buffer at an unprecedented pace" (May 9, 2026)
• Bloomberg Intelligence / BigGo Finance: "Strait of Hormuz Blockade Enters Week 10: Global Oil Inventories Near Operational Floor" (May 11, 2026)
• Chevron CFO Eimear Bonner interview, Bloomberg TV (May 1, 2026)
• Gunvor Group head of research Frederic Lasserre, quoted in Bloomberg / Fortune (May 9, 2026)
• JPMorgan commodities research, Natasha Kaneva, quoted in Bloomberg / Fortune (May 9, 2026)
• Morgan Stanley oil market outlook (May 2026)
• Kayrros geospatial inventory data (May 2026)
• Euronews: UNOPS warning on hunger crisis (May 12, 2026)
• Goldman Sachs Global Research (May 2026)

Edit: Link for infographic chart showing the data, edited the plain text list as well https://files.catbox.moe/i4pxm4.png

Edit2: Check out my analysis on why the current unemployment rate is inaccurate, and an employment rate that signals recessions historically!

https://www.reddit.com/r/investing/s/H64Un8MZ82

u/alemorg — 7 days ago

Building a Narcolepsy sentiment analysis tool using Reddit's public API; full details on anonymization, ToS compliance, and how this can help all of us

I'm building a tool that aggregates public Reddit posts and comments mentioning narcolepsy medications to identify common side effects, treatment patterns, and efficacy of medications. I have made various posts (links below) recently on evidence based approach for most effective treatments, best supplement, potential causes of narcolepsy, etc.

This is NOT for commercial use.

I'm one person with narcolepsy trying to fill a research gap that affects me and everyone here. I know what it's like to suffer with this condition, it's derailed my whole life. Medication research for this condition is scarce (mostly research funded by big pharma and small patient sizes) and real patient experiences with drugs like Xywav, modafinil, pitolisant, and sunosi are scattered across thousands of Reddit posts. There is a wealth of data that I believe could change people's lives.

I have also cited Reddit's ToS that allows me to do this. The academic papers cited did not ask for permission nor give you the ability to opt out, but I am.

What the tool does

It analyzes public posts/comments that mention narcolepsy medications, extracts mentions of side effects, and produces aggregate-level output like:

- "Among 200 posts mentioning Xywav, nausea appeared in ~30%, anxiety in ~20%"
- "Modafinil sentiment breakdown: 60% positive, 25% neutral, 15% negative"

It does NOT identify individuals, publish quotes, or profile users. It reports patterns at the medication level.

Reddit ToS compliance

Reddit's Public Content Policy states: "you can use Reddit content for non-commercial uses, such as learning and community." This project is non-commercial. I'm also using the official API within rate limits, accessing only public subreddits, and not touching private, quarantined, or deleted content. Reddit's Data API Terms are also clear: no user content will be used for ML/AI training or any commercial purpose, which I am not doing.

Reddit ToS links:

• Public Content Policy: https://support.reddithelp.com/hc/en-us/articles/26410290525844-Public-Content-Policy
• Data API Terms: https://redditinc.com/policies/data-api-terms

This has been done before, by actual researchers

Reddit-based health research is published in peer-reviewed journals regularly. A few examples:

- Pleasants E, et al. (2023). "Exploring Language Used in Posts on r/birthcontrol." J Med Internet Res, 25, e46342.
- Johnson AK, et al. (2022). "STD-Related Reddit Posts During the COVID-19 Pandemic." J Med Internet Res, 24(10), e37258. PMID: 36219757.
- Heidari O, et al. (2024). "Personal Experiences With Xylazine and Behavior Change." J Addict Med, 19(2), 135-142. PMID: 39329377.
- Adams NN. (2024). "'Scraping' Reddit posts for academic research?" Int J Soc Res Methodol, 27(1), 47-62.
- Turcan E, McKeown K. (2019). "Dreaddit: A Reddit Dataset for Stress Analysis in Social Media." LOUHI 2019, 97-107.

I'm following the same methodology and ethical framework these papers used. The Adams (2024) paper specifically outlines the ethical considerations for Reddit based research, including consent, anonymization, and data handling, and my tool follows those recommendations.

How anonymization works

  1. At collection: I only pull post text, subreddit name, month (not day), and score. Usernames, permalinks, profile URLs, avatars, flair, and user IDs are never stored. The raw API response is processed in memory and discarded immediately, nothing identifiable is stored.

  2. Text scrubbing: A preprocessing pass strips direct identifiers (u/ handles, emails, phone numbers, URLs, clinic names, street addresses, exact dates). Quasi-identifiers like age, location, and employer are generalized (e.g. "29-year-old nurse in Boise" becomes "adult healthcare worker in western US").

  3. Storage: Only the cleaned, de-identified analytic table is stored: subreddit, medication mention, side effect flag, month, and a sentiment score. No raw text. No way to trace anything back to a person.

  4. Output: Only aggregate statistics. Minimum threshold of 10 posts per subgroup. No individual quotes, no verbatim text, no cross-tabulations that could isolate a single person.

Opt-in vs opt-out

Some people have asked about consent. Here's why I'm doing opt-out rather than opt-in:

Opt-in is not standard practice for secondary analysis of public social media data. None of the published studies I cited used opt-in consent, because Reddit posts are public by default, ethics boards routinely classify this as exempt research, and requiring opt-in would create massive selection bias (only the most motivated people respond, skewing the data). Once data is properly anonymized, informed consent becomes structurally impossible to retroactively apply, and that's accepted practice in health informatics research.

I'm offering opt-out because I think people deserve the option, even though it's not required by ToS or standard research practice. I’m trying to do this right when other academic papers have not, considering I am part of this community not just a researcher.

How opt-out will work

Because all data is fully anonymized at the point of collection (usernames are never stored long-term), implementing opt-out requires a specific pipeline: usernames collected during the scrape will be hashed, checked against the opt-out list, matching posts excluded, and then the hashing salt destroyed , meaning exclusion is applied and can't be reversed or abused. I will update everyone once the mechanism is finalized, including a submission form.

Links to my recent posts:

https://www.reddit.com/r/Narcolepsy/s/mqegrd6GpU

https://www.reddit.com/r/Narcolepsy/s/c5XsZo9Ol5

https://www.reddit.com/r/Narcolepsy/s/jrO1OPfQbl

https://www.reddit.com/r/Narcolepsy/s/egbb28hTJA

https://www.reddit.com/r/Narcolepsy/s/Gz2QWADyeN

https://www.reddit.com/r/Narcolepsy/s/FWxu8RVOZS

reddit.com
u/alemorg — 8 days ago

What Causes Narcolepsy: An Evidence-Based Approach and Ranking

Just wanted to thank everyone for the positive comments I have received in my other posts. I also want to thank all the people who shared their personal experiences as that is very important. This post highlights the potential causes of narcolepsy and might shed some light on your journey and hopefully bring more understanding to your life. One thing I noted but wanted to repeat most of the research was done on European and Asian people, there is a huge gap in research for everyone else. Again please feel free to comments suggestions or let me know if there are any mistakes I need to correct.

Also currently I’m working on a post for research about children with narcolepsy, gender differences in narcolepsy (news flash, of course the research is centered around men and one ethnicity…), best medications for sleep (basically only sodium Oxybates), highest prevalence of comorbidities, and some miscellaneous research about narcolepsy. After I am done I want to build a Reddit sentimental analysis with the developer api key that filters through all the narcolepsy posts and comments so I can get a compilation of everyone’s subjective and anecdotal experiences. Also will probably run out of narcolepsy research so after I will research mental health disorders and then idk lol. Sorry that it’s so long. Go to the end of the post where it says key finding summary if you just want a brief overview.

1: HYPOCRETIN/OREXIN NEURON LOSS (The Core Pathology)

This is the most replicated finding in narcolepsy research. It has been confirmed across multiple independent laboratories, in postmortem tissue and in living patients via CSF measurement, for 25+ years with no credible contradiction.

Thannickal et al. 2000 (PMID 11055430): Postmortem hypothalamus, n = 3 NT1 brains versus 3 controls. Found an 85 to 95 percent reduction in hypocretin neuron count (p < 0.02). Remaining neurons were smaller and terminal bouton density was reduced. Melanin-concentrating hormone (MCH) neurons, which are intermixed with hypocretin neurons in the lateral hypothalamus, were completely spared. This proves the immune attack is selective, not general neurodegeneration. The n = 3 is small by modern standards but this finding has been replicated in over 50 postmortem brains across four independent laboratories since.

Nishino et al. 2000, Lancet (PMID 10615891): CSF hypocretin-1 was undetectable (< 40 pg/mL) in 7 of 9 NT1 patients (78 percent) and normal in all controls (p < 0.001). This was the first confirmation using an independent method, spinal fluid rather than brain autopsy. CSF hypocretin measurement has since been replicated hundreds of times and is now the diagnostic gold standard for NT1 per ICSD-3 criteria (cutoff ≤ 110 pg/mL).

Savvidou et al. 2013, Sleep (PMID 23288981): Showed that hypocretin deficiency develops during disease onset rather than being present from birth, establishing causation rather than just correlation. Exact onset-to-deficiency timeline statistics require full-text access, some articles are behind a paywall.

What makes this solid: The orexin neuron loss has been confirmed in more than 50 postmortem brains analyzed across labs at UCLA, Stanford, Leiden, and Tokyo. Every single NT1 brain studied shows severe loss. There is no contradicting finding after 25 years. Multiple independent methods (postmortem cell counting, CSF protein measurement, in situ hybridization) all converge on the same conclusion.

The limitations: Postmortem n is still small because hypothalamic autopsy tissue is scarce. Most brains studied were from end-stage disease, so the acute attack cannot be observed directly.

2: HLA-DQB1*06:02 (The Genetic Gate)

This is one of the strongest HLA-disease associations in all of medicine. It has been replicated in every ethnic population studied across dozens of independent cohorts over three decades.

Mignot et al. 1997 (PMID 9456467) and dozens of confirmations: 90 to 98 percent of NT1 patients carry HLA-DQB1*06:02 versus 12 to 25 percent of the general population, varying by ethnicity. The pooled odds ratio from European cohorts is approximately 30 (range across studies: 25 to 50). A negative DQB1*06:02 result has a negative predictive value above 99 percent in some cohorts, which means it essentially rules out NT1.

Zhang et al. 2025, PNAS (PMID 41364757): Largest transethnic narcolepsy GWAS ever conducted, pooling 5,339 cases from China, Europe, Korea, Japan, and the United States. Confirmed DQB1*06:02 as the primary risk allele across all populations and identified DQB1*03:01 as strongly affecting age of onset independently of DQA1 and ethnicity (p < 10^-8 after Bonferroni correction). Exact per-allele ORs require full-text access.

Ollila et al. 2015, American Journal of Human Genetics (PMID 25574827): Showed the HLA story is more nuanced. DQB1*06:02 homozygotes have approximately 2 times higher risk than heterozygotes carrying a neutral second DQB1 allele. Some DQB1 alleles — specifically DQB1*06:01, DQB1*06:03, and DQB1*05:01 — are actually protective (OR < 0.5). Exact OR and CI per allele require full-text access.

Capittini et al. 2018, Sleep Medicine (PMID 30321823): Meta-analysis quantifying diagnostic utility across four ethnic groups: Asians, Afro-Americans, Amerindians, and Caucasians. Pooled diagnostic sensitivity was 91 percent and specificity was 73 percent for detecting NT1. Sensitivity was highest in Caucasians and Asians and lower in African-Americans and Amerindians, consistent with the ethnic differences in DQB1*06:02 positivity rates discussed below. Exact CIs around sensitivity and specificity require full-text access.

What the numbers mean: This is a gate, not a trigger. Only about 1 percent of people who carry DQB1*06:02 ever develop narcolepsy. The allele is necessary but not sufficient. The question is what pushes that 1 percent through the gate, and that is where the environmental trigger evidence comes in.

DISCLAIMER: (The ethnic gap in the data matters). Most DQB1*06:02 research comes from European and Asian cohorts where positivity runs 90 to 98 percent. In a Brazilian study of 21 NT1 patients (Bacelar et al. 2024, PMID 39150697), only 61.9 percent carried DQB1*06:02 despite elevated odds versus controls (18.0 percent), which suggests other HLA alleles are contributing in admixed Latin American populations. African Americans show high DQB1*06:02 positivity (91 percent per Kawai et al. 2015, PMID 26158891) but are 4.5 times more likely to have NT1 without cataplexy than Caucasians, and their CSF hypocretin is more frequently low (93.9 percent vs 61.5 percent). Neither Black Americans, Indigenous Americans, nor admixed Latin American populations have been adequately studied for narcolepsy-specific HLA genetics. The 90 to 98 percent figure is a European and Asian finding, not a universal one.

The limitation: Genetic association does not equal causation. GWAS-level resolution tells us the allele is involved but cannot tell us the precise functional mechanism without complementary immunology studies.

3: INFECTION AS THE TRIGGER (H1N1 and Pandemrix)

The epidemiological evidence that narcolepsy onset follows infections, particularly H1N1 influenza, is extremely strong. This is arguably the best-established environmental trigger for any autoimmune disease.

Han, Mignot et al. 2011, Annals of Neurology (PMID 21866560): Analysis of 906 Chinese NT1 patients. Onset showed a strong seasonal pattern peaking in April through August (spring and summer months). Monthly onset rate correlated with influenza and upper airway infection rates at the population level. There was a roughly 6-month delay between the 2009 H1N1 pandemic peak in China and the narcolepsy onset peak, with a 3-fold increase in new-onset narcolepsy in 2010 versus the pre-pandemic baseline (cross-correlation showed a significant 5- to 7-month delay between the seasonal peak in influenza infections and peak in narcolepsy onset, p < 0.001). Critically, China did not use the Pandemrix vaccine, so this signal came from wild-type infection alone.

Multiple European Pandemrix studies 2012 to 2018: In Finland, Nohynek et al. 2012 (PMID 22470453) found a rate ratio of 12.7 (95% CI 6.1 to 30.8, p < 0.001) for childhood narcolepsy following the Pandemrix vaccination campaign (incidence 9.0 per 100,000 person-years in vaccinated versus 0.7 per 100,000 in unvaccinated), with a vaccine-attributable risk of 1 case per 16,000 vaccinated children aged 4 to 19 years. Sweden, Norway, the UK, Ireland, and France all independently reported 3 to 14-fold increases using different health systems and different study designs. Adult risk was elevated 2 to 7-fold. The signal was so strong that Finland suspended Pandemrix use in August 2010.

Sarkanen et al. 2018 (PMID 29855798): Review summarizing the Pandemrix-narcolepsy evidence across multiple countries. Pandemrix-triggered cases had more severe clinical presentations including younger age of onset, more psychiatric comorbidities, and more pronounced polysomnographic abnormalities compared with sporadic narcolepsy. The consistency of findings across independent health systems confirms these cases were genuine narcolepsy rather than misdiagnosis.

What makes this strong: Multi-country replication with different healthcare systems, different study designs, all pointing to the same conclusion. The temporal association was extremely tight with onset occurring 0 to 12 months post-vaccination. The Chinese data provides convergent evidence from wild-type infection without any vaccine confound. The 6-month delay between infection peak and onset peak matches the known timeline for autoimmune disease development.

The limitation: Only Pandemrix, which used the AS03 adjuvant (squalene plus alpha-tocopherol), was associated with narcolepsy. Other H1N1 vaccines were not. Why Arepanrix, same AS03 adjuvant, used in Canada, did not produce a narcolepsy signal remains debated. Vaarala et al. 2014, PLoS ONE (PMID 25501681): n = 47 children with Pandemrix-associated narcolepsy versus 57 healthy Pandemrix-vaccinated children. Found increased circulating IgG antibodies to Pandemrix H1N1 antigen in the narcolepsy group, and identified higher amounts of structurally altered viral nucleoprotein in Pandemrix compared to Arepanrix. This supports the molecular mimicry model by showing a physical antigenic difference between the two vaccines that could explain the different risk profiles. Exact antibody titer CIs require full-text access.

Stowe et al. 2020, PLoS Medicine (PMID 32926731): Reassessed narcolepsy risk 8 years after Pandemrix in England using a case-coverage design. The odds ratio for narcolepsy onset at any time after vaccination was 1.94 (95% CI 1.30 to 2.89), with the elevated risk period restricted to onsets within 12 months of vaccination. Important because it confirmed the risk was not just a short-term shift in diagnosis timing, the signal persisted as a long-term elevation rather than being explained by Pandemrix merely accelerating inevitable narcolepsy onset.

Ambati et al. 2015, Journal of Internal Medicine (PMID 25683265): n = 38 Pandemrix-vaccinated narcolepsy cases (all DQB1*06:02 positive) and 76 matched controls (23 DQB1*06:02 positive, 53 negative). IFN-γ production was significantly increased in response to streptococcus M6 serotype (p = 0.0065) and streptodornase B protein (p = 0.0050). T-cell recognition was confirmed at the single-cell level by intracellular cytokine staining (IL-2, IFN-γ, TNF-α, and IL-17). This suggests streptococcal infection may be an additional trigger beyond influenza, consistent with the broader post-infectious autoimmune model.

4: AUTOREACTIVE CD4+ T-CELLS TARGETING HYPOCRETIN (The Mechanism)

This is the mechanistic heart of the autoimmune model. These papers form a progressive chain of evidence from blood to brain.

Latorre, Sallusto, Mignot et al. 2018, Nature (PMID 30232458): n = 19 NT1 patients and 13 healthy controls. Used HLA-DQ0602 tetramers loaded with hypocretin peptides to detect autoreactive CD4+ T-cells. Found hypocretin-specific CD4+ T-cells in all 19 NT1 patients (100 percent) and in 0 of 13 controls (0 percent, p < 0.0001 by Fisher's exact test). Also detected CD8+ T-cells targeting hypocretin. Single-cell TCR sequencing revealed shared CDR3 motifs across patients. Tetramer technology is the gold standard for antigen-specific T-cell detection, and Nature is as credible as journals get. The limitation is that the T-cell responses were detected only in peripheral blood, not in brain tissue, so this does not prove these cells actually cross the blood-brain barrier and kill neurons in vivo.

Luo, Mignot et al. 2018, PNAS (PMID 30541895): n = 35 NT1 patients and 22 DQ0602 controls. Demonstrated that the C-amidated form of hypocretin peptides (HCRT-NH2), not the native form, are the autoantigens. HLA-DQ0602 binding to hypocretin peptides occurs in 98 percent of NT1 patients versus 25 percent of the general population due to DQB1*06:02 enrichment in patients. The key finding: influenza A hemagglutinin (pHA 273-287) and nucleoprotein (NP 17-31) peptides share sequence homology with HCRT-NH2. T-cells cross-reactive to both flu peptides and hypocretin peptides were found in NT1 patients. Single-cell TCR analysis showed identical CDR3-beta sequences in HCRT-NH2 and pHA tetramer-positive cells from the same patient. This is direct evidence of molecular mimicry: flu-specific T-cells cross-recognize hypocretin, explaining HOW an infection triggers autoimmunity. The limitation: the authors themselves noted they were unable to replicate some of the results, and sample processing differences may affect tetramer staining.

Shan, Fronczek, Lammers et al. 2026, Annals of Neurology (PMID 41830424): Postmortem NT1 hypothalamic tissue, n = 7 NT1 and 6 controls. Found an approximately 11-fold increase of CD4+ T-cells in the hypocretin region versus control hypothalami (p < 0.001). No corresponding increase in CD8+ T-cells was observed, suggesting CD4+ cells are the primary infiltrating cells. This is the first direct evidence of T-cell infiltration at the actual site of neuron loss in human brain, which closes a major gap in the autoimmune hypothesis. The limitation: postmortem tissue means end-stage disease, so the acute attack phase cannot be observed.

Jiang et al. 2019, Nature Communications (PMID 31748512): n = 15 NT1 patients. Demonstrated in vivo clonal expansion of hypocretin-specific CD4+ T-cells with a Th1/Th17 phenotype capable of crossing the blood-brain barrier. Hypocretin-specific T-cells recognized the same hypocretin peptides presented by DQ0602 across multiple patients, confirming a shared autoimmune mechanism rather than patient-specific random reactivity. Exact clonal frequency statistics require full-text access. Published in Nature Communications with the Mignot group. The limitation: n = 15 is modest and all were adult NT1.

Cogswell et al. 2019, Annals of Clinical and Translational Neurology (PMID 31730293): n = 27 children with NT1 versus 15 controls. Observed higher frequencies of IFN-γ-producing and TNF-α-producing CD4+ and CD8+ T-cells in response to orexin peptides in children with NT1. Important because it shows T-cell autoreactivity in children close to disease onset, which is when the autoimmune attack is most active. Exact fold-difference statistics require full-text access.

Bernard-Valnet et al. 2022, Brain (PMID 35552381): Mouse model study. Showed that influenza vaccination in DQ0602-transgenic mice induced autoreactive CD4+ T-cells targeting orexin neurons, leading to sleep fragmentation and sleep attacks. This is the closest thing to direct experimental proof that vaccination can trigger orexin neuron autoimmunity in a controlled setting. The limitation: this is a mouse model, not human data, and mouse immune responses do not always translate perfectly.

What the progression means: These papers together form an unusually complete causal chain spanning human blood, human brain, and a controlled mouse model. Autoreactive cells found in blood (Latorre 2018, 19/19 vs 0/13, p < 0.0001), molecular mimicry between flu and hypocretin demonstrated (Luo 2018), clonal expansion of these cells confirmed in patients (Jiang 2019), flu vaccine triggering the process shown in a mouse model (Bernard-Valnet 2022), and T-cells confirmed at the lesion site in human brain (Shan 2026, 11-fold increase, p < 0.001). The main remaining gap is proving these T-cells are directly responsible for neuron killing in humans, which would require an interventional study that is ethically impossible.

5: CD8+ T-CELLS (The Killer Cells)

Pedersen, Kornum et al. 2019, Nature Communications (PMID 30783092): n = 20 NT1 patients and 52 healthy controls. Screened 1,183 peptides from 7 proteins enriched in hypocretin neurons. Found CD8+ T-cells in NT1 patients that recognize peptides from HCRT, RFX4, and other hypocretin-neuron-enriched proteins. The frequency of autoreactive CD8+ T-cells was higher in NT1 patients than in controls. Importantly, healthy DQB1*06:02 carriers actually had lower frequencies of autoreactive CD8+ T-cells than both NT1 patients and non-carrier controls, suggesting active immune regulation in protected individuals. Exact frequency and fold-difference statistics require full-text access.

Why CD8+ matters: CD8+ T-cells are the cytotoxic killer cells. In the standard autoimmune model, CD4+ cells provide help and CD8+ cells execute the kill. Finding CD8+ autoreactivity makes the mechanistic story logically complete.

Luo et al. 2021, Scientific Reports (PMID 33837283): Extended the autoantigen search beyond hypocretin. Found T-cell reactivity to Regulatory Factor X4 (RFX4), a protein co-localized with hypocretin in orexin neurons, in NT1 patients. This suggests the autoimmune attack may target multiple proteins in orexin neurons, not just hypocretin peptides, which would explain the completeness of neuron destruction.

Huth et al. 2024, Journal of Autoimmunity (PMID 38663202): Single-cell transcriptomics of cerebrospinal fluid cells from patients with recent-onset NT1. Found activated CD4+ T-cells and clonally expanded CD8+ T-cells in the CSF of recent-onset patients, showing the immune activity is not just in blood but in the central nervous system compartment. This is closer to the site of damage than any previous blood-based study.

The complication: Shan 2026 (Section 4) found CD4+ dominance, not CD8+ dominance, at the actual lesion site in postmortem brains. This creates a discrepancy. The field may be moving toward a CD4+ dominant model where CD4+ T-cells are themselves directly cytotoxic, or toward a model where CD8+ cells execute the kill and then leave the tissue while CD4+ cells remain. The CD8+ detection methodology using tetramers is also less well-established than the CD4+ equivalent.

The comprehensive reviews: Liblau, Latorre, Kornum, Dauvilliers, and Mignot 2023 in Nature Reviews Immunology (PMID 37400646) is the definitive synthesis. These are the top five living narcolepsy immunologists and they published in the top immunology review journal. Kornum and Jennum 2020 (PMID 31961748) stated directly: "We propose that the evidence for NT1 being an autoimmune disease is now overwhelming." Freeman, Ayoub, Dauvilliers, and Liblau 2025 (PMID 40373365) provides the latest synthesis covering both hypothesis-driven and hypothesis-generating approaches. The autoimmune model is the consensus view among leading researchers. What remains debated is mechanism details, not the autoimmune framework itself.

6: TRIB2 AUTOANTIBODIES

This is interesting but not central. The evidence comes primarily from one research group and independent replication has been inconsistent.

Kawashima, Mignot et al. 2010, Sleep (PMID 20614846): n = 85 NT1 patients. Anti-TRIB2 antibodies were found in 14 to 26 percent of NT1 patients depending on assay method, with the highest levels in those within 2.3 years of cataplexy onset. Rarely found in controls (< 5 percent). The temporal association, highest near onset, is the strongest supportive element, but the absolute rate of 14 to 26 percent means the majority of NT1 patients test negative for these antibodies.

Katzav et al. 2013, Journal of Autoimmunity (PMID 23834844): Passive transfer experiment. IgG from anti-TRIB2-positive NT1 patients was injected into mice (n = 6 per group), which then developed hypothalamic orexin neuron loss and sleep attacks. If reproducible, this is Koch's postulates-level evidence directly demonstrating antibody pathogenicity. But it has not been independently replicated, and multiple labs have been unable to reproduce the passive transfer model.

Bottom line: TRIB2 antibodies are present in a minority of patients and the passive transfer model is provocative but unvalidated and unreplicated. These antibodies may represent an epiphenomenon where neurons die first, TRIB2 is released as debris, and antibodies form secondarily, rather than being a primary cause.

7: GENETIC LOCI BEYOND HLA

The non-HLA genetic evidence is solid but the individual effect sizes are small. These are risk modifiers, not causal genes. What matters is the consistent pattern: essentially all non-HLA narcolepsy risk genes are immune-related.

Hallmayer, Mignot et al. 2009, Nature Genetics (PMID 19412176): GWAS with 1,830 European cases plus 2,164 controls, replicated in 3 independent cohorts. Identified TCRA (T-cell receptor alpha locus) as the second strongest genetic association (rs1154155, OR 1.69, 95% CI 1.45 to 1.96, p = 3.4 × 10^-12). Also found P2RY11 (OR 1.28), CTSH (OR 1.23), ZNF365 (OR 1.17), and TNFSF4 (OR 1.19). All are immune-related. The TCRA finding is especially important because it is the T-cell receptor locus, directly implicating T-cells in pathogenesis. Replicated in Asian populations (Han 2012, PMID 22177342). Exact CIs for the smaller-effect SNPs require full-text access, behind a paywall.

Ollila, Mignot et al. 2023, Nature Communications (PMID 37188663): Extended GWAS with transcriptomic enrichment analysis. Confirmed enrichment of risk variants in CD4+ T-cells, monocytes, and dendritic cells. Implicated TRA-J24, a T-cell receptor joining segment, in narcolepsy susceptibility. This integrates GWAS with functional genomics showing the genetic risk converges on specific immune cell types. Exact enrichment p-values require full-text access.

What each gene does and why it matters: TCRA encodes the T-cell receptor alpha chain and determines which antigens T-cells recognize. P2RY11 is a purinergic receptor regulating immune cell survival and migration. CTSH is cathepsin H, a protease involved in antigen processing for MHC presentation. ZNF365 is a zinc finger protein involved in immune regulation. TNFSF4 is OX40 ligand, a T-cell co-stimulatory molecule. CPT1B and CHKB are metabolic genes with unclear mechanism, possibly affecting neuronal vulnerability to immune attack.

The limitation: Non-HLA effect sizes are small (ORs of 1.2 to 1.7) compared to HLA (OR ~30). Genetic association does not equal causation. But the pattern is the story: everything points to T-cells and antigen presentation.

8: NT1 vs NT2 (Partial Orexin Loss)

NT2 is less studied than NT1. The evidence suggests some orexin neuron loss occurs in at least a subset of NT2 patients, but the data is thin.

Key differences: NT1 shows CSF hypocretin-1 at or below 110 pg/mL in 85 to 95 percent of patients, HLA-DQB1*06:02 in 90 to 98 percent, and 85 to 95 percent orexin neuron loss in postmortem tissue. NT2 shows normal CSF hypocretin (above 200 pg/mL) in most patients, HLA-DQB1*06:02 in only 40 to 50 percent, and roughly 0 to 33 percent orexin neuron loss based on very limited postmortem data.

Thannickal, Siegel et al. 2009, Sleep (PMID 19725250): Postmortem analysis of 5 NT2 brains. The one patient with a full brain available for study showed 33 percent overall hypocretin cell loss versus 85 to 95 percent in NT1. The loss was localized to the posterior hypothalamus. This suggests NT1 and NT2 may be different severities of the same disease process. But n = 1 for the full-brain count, and the other 4 brains were partial specimens. The 33 percent figure needs replication urgently.

van der Hoeven et al. 2022, Sleep (PMID 35554594): Retrospective cross-sectional study, n = 355 people with known CSF hypocretin-1 levels, n = 271 with full cataplexy characterization. Compared to those with normal hypocretin (> 200 pg/mL), individuals with intermediate hypocretin-1 levels (111-200 pg/mL) were significantly more likely to have typical cataplexy (75 percent or 12 of 16 vs 9 percent or 8 of 88, p < 0.05) and to meet diagnostic PSG and MSLT criteria for narcolepsy (50 percent vs 6 percent, p < 0.001). Of those with typical cataplexy, 88 percent had low hypocretin, 7 percent had intermediate levels, and 5 percent had normal levels. The authors suggest raising the NT1 diagnostic hypocretin-1 cutoff to capture the intermediate group. This provides quantitative evidence that NT1 and NT2 exist on a spectrum rather than as a clean binary.

What this means: If CSF hypocretin is normal in most NT2 patients, what actually causes their excessive daytime sleepiness? Possibilities include orexin loss below the detection threshold of lumbar CSF measurement, dysfunction in a different neurochemical system, or NT2 being a different disease that happens to share symptoms with NT1. The field does not have a clean answer.

9: EMERGING AND UNCERTAIN FINDINGS

SARS-CoV-2 as a trigger: Multiple case reports from 2021 to 2025 describe new-onset NT1 following COVID-19 infection. Wang et al. 2025 (PMID 39729629) reported ofatumumab, an anti-CD20 B-cell depletion therapy, used in a 9-year-old with apparent benefit (n = 1). Biologically plausible given the established post-infection narcolepsy model, but systematic epidemiological data is lacking. Post-COVID narcolepsy incidence has not shown the dramatic spike seen with 2009 H1N1, which is consistent with different viral protein sequences: SARS-CoV-2 lacks the H1N1 nucleoprotein mimicry epitope.

CRH neuron co-loss: Zhou et al. 2026, Journal of Sleep Research (PMID 40707858): Reported an 88 percent reduction in corticotropin-releasing hormone neurons of the paraventricular nucleus in postmortem NT1 brains in addition to orexin neuron loss. Exact n and p-value require full-text access, and independent replication is needed. If confirmed, this would expand the pathological picture beyond orexin.

Autoimmune comorbidities: NT1 patients have elevated rates of other autoimmune diseases. Hashimoto's thyroiditis is 2 to 3 times more common, type 1 diabetes has shown association in some studies, and psoriasis is modestly elevated. Overall autoimmune comorbidity rate is roughly 15 to 20 percent versus 5 to 8 percent in the general population. This is consistent epidemiological support, but it is confounded by surveillance bias, NT1 patients see doctors more frequently.

Why are MCH neurons spared: MCH neurons are physically intermingled with orexin neurons in the lateral hypothalamus but are completely untouched in NT1. Leading hypotheses include that MCH neurons do not express the antigen targeted by autoreactive T-cells, have lower MHC class I expression making them less visible to CD8+ T-cells, or have a different developmental lineage with different immune vulnerability. No definitive evidence exists for any hypothesis.

What protects the 99 percent of DQB1*06:02 carriers who never get narcolepsy: This is arguably the most important unanswered question. Pedersen 2019 (PMID 30783092) showed that healthy DQB1*06:02 carriers actually had lower frequencies of autoreactive CD8+ T-cells than both NT1 patients and non-carrier controls, suggesting active deletion or suppression of these autoreactive cells in protected individuals. Other possibilities include never developing the right T-cell clone that cross-reacts with hypocretin, having protective HLA alleles like DQB1*06:01 that compete for peptide binding, effective regulatory T-cell mediated suppression, and never encountering the right trigger at the right time.

WHO WAS STUDIED (AND WHO WASN'T)

The narcolepsy etiology evidence base breaks down by continent as follows. We have data from Europe (postmortem brain banks, Pandemrix registries, GWAS, T-cell studies), North America (US postmortem tissue, US GWAS, clinical cohorts), and East Asia (Chinese and Japanese GWAS, Chinese H1N1 infection data). We have almost nothing from Africa, South Asia, the Middle East, Oceania, or Indigenous communities anywhere. Latin America has one Brazilian HLA study (Bacelar 2024, n = 21) and essentially nothing else. Molecular mimicry between flu and hypocretin has been demonstrated only in European HLA contexts, and the Brazilian finding of only 61.9 percent DQB1*06:02 positivity in NT1 suggests the mechanism may differ across populations. This does not invalidate the autoimmune model but it means the model was built on a narrow slice of humanity.

Of the 5,339 cases in the largest transethnic GWAS (Zhang 2025), the vast majority came from China, Europe, Korea, Japan, and the United States. There were zero Indigenous American, zero African, zero South Asian, and zero Middle Eastern cohorts with GWAS-level data. The Pandemrix signal was detected only because Western European countries had nationalized health registries with linked vaccination and diagnostic records. If Pandemrix had been distributed primarily in sub-Saharan Africa, we would not have detected the narcolepsy signal because the surveillance infrastructure did not exist there. This is not a failure of the research, it is a reflection of where the research funding, infrastructure, and published cohorts are concentrated.

WHAT WE STILL DON'T KNOW

Can we intervene early to save orexin neurons? If diagnosed within weeks of onset, could immunotherapy such as anti-CD20, CTLA4-Ig, or corticosteroids prevent complete neuron loss? The ofatumumab case report is provocative but only n = 1. This is where the field needs to go, from understanding the mechanism to intercepting it.

Why Pandemrix and not Arepanrix? The AS03 adjuvant difference hypothesis, Pandemrix contained higher amounts of structurally altered viral nucleoprotein per Vaarala 2014, is plausible but not fully proven in an epidemiological framework.

How do autoreactive T-cells cross the blood-brain barrier to access the hypothalamus? Is BBB breakdown a prerequisite for disease?

What makes orexin neurons specifically vulnerable? These roughly 70,000 neurons out of billions in the brain are the target. Understanding why could unlock protective strategies.

What is the full autoantigen repertoire? Hypocretin peptides are targets, but are there others like RFX4 or TRIB2?

KEY FINDINGS SUMMARY

What causes narcolepsy: An autoimmune attack, likely triggered by influenza or other infections in people who carry HLA-DQB1*06:02, selectively destroys the ~70,000 hypocretin/orexin neurons in the hypothalamus. The strongest epidemiological signal is the Pandemrix H1N1 vaccine campaign which produced a rate ratio of 12.7 (95% CI 6.1 to 30.8) for childhood narcolepsy. The strongest mechanistic evidence is the detection of autoreactive CD4+ T-cells targeting hypocretin in 19 of 19 patients versus 0 of 13 controls (p < 0.0001) and the confirmation of CD4+ T-cell infiltration at the lesion site in postmortem human brain (11-fold increase, p < 0.001). Genetic risk is dominated by HLA-DQB1*06:02 (OR ~30) with smaller contributions from TCRA (OR 1.69, 95% CI 1.45 to 1.96) and other immune genes (ORs 1.2 to 1.7). The autoimmune model is the consensus view among leading researchers. Major evidence gaps exist for populations outside Europe and East Asia, and for the earliest stages of disease before complete neuron loss.

If you want to verify any paper, every PMID in this post resolves to PubMed directly. Copy the PMID number and paste it into pubmed.ncbi.nlm.nih.gov.

PLAIN ENGLISH KEY

Key measurements and concepts:
- CSF hypocretin-1: hypocretin/orexin protein level measured in spinal fluid via lumbar puncture. Normal is above 200 pg/mL. Below 110 pg/mL is diagnostic for NT1.
- OR (odds ratio): How much more likely someone with a genetic variant is to have the disease. OR of 30 means 30 times higher odds.
- 95% CI (95 percent confidence interval): The range within which the true effect is 95 percent likely to fall. A CI that does not cross 1.0 is statistically significant.
- p-value: probability the result occurred by chance. p < 0.05 is the standard threshold for statistical significance. Smaller p-values mean stronger evidence.
- Rate ratio: like an OR but for incidence rates over time. A rate ratio of 12.7 means 12.7 times more cases per unit of time in the exposed group.
- LSMD (least squares mean difference): The average difference between treatment and placebo after adjusting for baseline.
- GWAS (genome-wide association study): Scans the entire genome for variants that differ between patients and controls.
- Tetramer: a laboratory tool that tags T-cells specific to a particular antigen. The gold standard for proving a T-cell targets a specific protein.
- TCR (T-cell receptor): The molecule on T-cells that recognizes antigens. TCR sequencing can trace whether the same T-cell clone recognizes two different targets (molecular mimicry).
- Molecular mimicry: when an immune response against a pathogen cross-reacts with a similar-looking self-protein, causing autoimmunity.
- MHC / HLA: the proteins that present antigen fragments to T-cells. HLA-DQB1*06:02 is the specific variant that presents hypocretin peptides in narcolepsy.
- CD4+ T-cell: helper T-cell that coordinates immune responses and presents antigens.
- CD8+ T-cell: cytotoxic killer T-cell that directly destroys target cells.
- Postmortem: brain tissue studied after death. The only way to directly examine orexin neurons in humans.
- n: sample size. Smaller n means less reliable estimates.
- PMID: PubMed ID number for verifying a scientific paper.
- Epiphenomenon: something that happens alongside the disease but is not the cause.
- Passive transfer: injecting antibodies from a patient into an animal to see if they cause disease. A way to test whether antibodies are pathogenic.

What "necessary but not sufficient" means: DQB1*06:02 is required for most NT1 cases (necessary), but having it does not guarantee disease (not sufficient). You also need an environmental trigger and the right T-cell clone.

What "Koch's postulates" means: a classic standard for proving a microbe causes a disease. In autoimmunity, the equivalent is showing that transferring the immune component (antibodies or T-cells) from a patient to an animal recreates the disease.

What "consensus view" means: the position held by the leading researchers in the field based on the weight of available evidence. It is not proven fact, but it is the best-supported interpretation.

STATISTICS NOTE

Where exact CIs and p-values appear in this post, they were verified against the published paper abstracts or the full text via PubMed. Where "full-text access required" is noted, the abstract confirmed the direction and magnitude of the effect but did not include the complete confidence interval or exact p-value. These values exist in the papers, they simply are not extractable from abstracts alone. Every paper cited here is a real publication with a verifiable PMID. Anyone with institutional full-text access can pull the exact statistics from the original paper. No number in this post was fabricated or estimated, every statistic reported is directly from the cited source or explicitly marked as requiring full-text confirmation.

METHODS NOTE

Papers were identified through PubMed MeSH searches for Narcolepsy/etiology, Narcolepsy/immunology, and Narcolepsy/genetics, citation tracking from key reviews, and author tracking of Mignot, Liblau, Kornum, Dauvilliers, Lammers, Nishino, Siegel, and Sallusto. All PMIDs were verified directly against PubMed as of May 12, 2026. Statistics were extracted from PubMed abstracts where available and supplemented by full-text verification through Europe PMC and Semantic Scholar where accessible.

Edit: Link to my new post about a sentimental analysis tool I want to make to benefit everyone here

https://www.reddit.com/r/Narcolepsy/s/80CIiyM9aa

reddit.com
u/alemorg — 9 days ago

The Most Effective Treatments for Cataplexy: An Evidence-Based Ranking

Just to give some context, I’ve posted various research compilations so far. Disclaimer that just because the research says something doesn’t mean it’s an undeniable fact. Narcolepsy research is so scarce and that’s why I highly encourage others to share their experience with medications. The api keys I pulled data from should encompass everything western countries alongside major Asian countries have published. Anything that I don’t have is gated Chinese research or niche Russian or South East Asian research that didn’t make it to the major medical journals world wide. Also I have narcolepsy myself so I’m not just some researcher who doesn’t understand what it’s like. I’ve actually tried every narcolepsy medication available and posted my experience, but that was awhile ago. Also I’m not a doctor, but I do recommend you bring this research up with your doctor. I know I’ve told my doctors that stuff I’ve been up to lol.

Also please suggest any narcolepsy research topics you want me to do a deep dive on. Because the research is so scarce I’d have probably touched upon every corner of narcolepsy research that I can access by end of month or sooner. I might even build a tool that references Reddit posts and comments to build a sentimental analysis to see what are people’s overall subjective experience but Reddit needs to grant me developer api key access.

1: SODIUM OXYBATE (Xyrem / Xywav / Lumryz)

Class: Oxybate with GABA-B agonist effects. Schedule III.
Status: FDA-approved for cataplexy.
Strongest established evidence base.

REST-ON (Kushida 2022, PMID 34358324): Phase 3, n=212 (222 randomized), once-nightly sodium oxybate. At 9 g, weekly cataplexy rate LSMD was -6.65 versus placebo, with a 95% CI of -9.32 to -3.98, and all dose levels were statistically significant versus placebo.
LXB withdrawal study (Bogan 2021, PMID 33184650): Randomized withdrawal design, n=134 randomized after open-label titration. Participants switched to placebo had significant worsening in cataplexy compared with those who stayed on lower-sodium oxybate.
LXB cataplexy analysis (Dauvilliers 2022, PMID 35635687): Post-hoc analysis showing lower-sodium oxybate maintained anticataplectic benefit while other anticataplectics were tapered, and the formulation contains 92% less sodium than sodium oxybate.
SXB meta-analysis (Amin 2024, PMID 39601985): Systematic review and meta-analysis of 5 RCTs supporting sodium oxybate efficacy and safety.

What the numbers mean: LSMD -6.65 is a real effect, not a rounding error. If somebody is having 15 to 20 attacks a week, that is a major clinical change.
What makes oxybate different is that it can also improve excessive daytime sleepiness and disrupted nighttime sleep at the same time, which is a big reason it stays at the top of the list.

Formulations: Xyrem is the original twice-nightly sodium oxybate, Xywav is the lower-sodium version, and Lumryz is the once-nightly sodium oxybate formulation.

Funding: The oxybate trials were industry-funded.

2: PITOLISANT (Wakix)

Class: H3 receptor inverse agonist. Unscheduled.
Status: FDA-approved for cataplexy.
Positive randomized evidence, but less robust than oxybate.

Pivotal adult trial (Szakacs 2017, PMID 28129985): Phase 3 RCT, n=106, 7 weeks. The primary endpoint was 50% or greater reduction in weekly cataplexy rate, achieved by 75% of pitolisant patients versus 38% on placebo, with RR 0.512 and 95% CI 0.335 to 0.780.
Pediatric trial (Dauvilliers 2023, PMID 36931805): Phase 3 randomized trial, n=110, showing significant reduction in cataplexy versus placebo in children and adolescents with narcolepsy.
Pooled analysis (Meskill 2022, PMID 34935103): Post-hoc pooled analysis supporting anticataplectic benefit across subgroups, including people taking stimulants.

The good part is obvious: it has real RCT data, it is not a controlled substance, and it avoids the oxybate REMS burden.
The limitations matter too: the main adult cataplexy trial was only 7 weeks, it was conducted entirely at Eastern European sites (a generalizability concern), the trial program was industry-funded, and there are still no head-to-head cataplexy trials versus oxybate.

Bottom line: Pitolisant is the only FDA-approved non-scheduled cataplexy option.

3: ANTIDEPRESSANTS (venlafaxine, clomipramine, fluoxetine, others)

Class: SNRI, TCA, SSRI.
Status: Off-label, but heavily used in real-world practice.
Big clinical importance, weak formal evidence.

This is the awkward part of cataplexy treatment. Antidepressants have been used for decades and are prescribed constantly, but the evidence base is much weaker than most people think.

There is no strong modern randomized evidence base for the main off-label anticataplectics used in practice now, especially venlafaxine and clomipramine, and the overall cataplexy evidence remains sparse and low quality.

Jin 2019 (PMID 30837110): Prospective observational study, n=148, in northern China. Patients were followed for 1-6 years after treatment. All antidepressants improved cataplexy and cataplexy-like episodes versus baseline, and venlafaxine demonstrated significantly greater improvements in mean sleep latency on the MWT compared with other antidepressants. This is real-world data, but it is observational, not blinded or randomized.

An older crossover study (Schachter 1980, PMID 6766990) randomized 18 patients to fluvoxamine 25-200 mg and clomipramine 25-200 mg for separate three-week periods. Both drugs improved cataplexy but not daytime sleepiness. Clomipramine was more active, both drugs abolished cataplexy in individual subjects, but gastrointestinal side effects prevented fluvoxamine treatment in 5 of 18 patients. This is the closest thing to controlled evidence for the older antidepressants, and it is a small study from 1980.

European guideline (Bassetti 2021, PMID 34173695): The European guideline supports sodium oxybate strongly and also includes venlafaxine and clomipramine for adult cataplexy, but the antidepressant recommendation is based much more on expert consensus and long clinical experience than on high-quality trial data.
AASM guideline (Maski 2021, PMID 34743790): This guideline mainly reviewed FDA-approved therapies and does not function as a strong modern evidence review for off-label antidepressants in cataplexy.

Bottom line: This is the biggest gap between what the literature proves and what actually happens in clinics. Venlafaxine and clomipramine matter a lot in the real world, but the formal evidence is much thinner than it should be.

4: OTHER OFF-LABEL OPTIONS (weak evidence)

This section is mostly here for completeness, not because these are strong evidence-based choices.

Clonazepam: Kansagra 2013 (PMID 23674942) included chart-review style evidence suggesting improvement in 10 of 14 patients, but that is a very weak signal and not enough to rank it near the main options.

Tropatepine: Nigam 2021 (PMID 33231168) was a case series of three patients with severe, drug-resistant cataplexy who experienced dramatic improvement after multiple prior failures. Interesting, but three patients is not decision-grade evidence.

Cannabis / THC: there are many anecdotes, almost no usable clinical data, and a plausible downside because cannabis can fragment sleep architecture in a population that already has unstable sleep.
Bottom line: not something I would present as evidence-based treatment. (Personal Experience: THC makes my cataplexy worse, don’t tell my sleep specialist lol)

PIPELINE (Not Available Yet; Ranked by Promise, Not Past Evidence)

OVEPOREXTON (TAK-861) - Takeda

Class: Oral OX2R agonist. Disease-targeting in concept.
Status: Late-stage development. Two positive Phase 3 topline readouts reported by the sponsor.
Highest-promise pipeline drug so far.

Ph2b (NEJM 2025, PMID 40367374): n=112, 8-week RCT. Weekly incidence of cataplexy at week 8 was 4.24, 3.14, 2.48, 5.89, and 8.76 across the dose groups and placebo, with significant benefit on cataplexy, wakefulness, and sleepiness endpoints.
The same abstract reports common adverse events of insomnia in 48%, urinary urgency in 33%, and urinary frequency in 32%, with no hepatotoxic effects observed in that trial. The high insomnia rate is notable — it reflects the wake-promoting mechanism at the wrong time of day, which is an inherent challenge for orexin agonists.

FirstLight Ph3 (NCT06470828): Phase 3, global placebo-controlled study. The sponsor reported all primary and secondary endpoints met, including cataplexy, with p<0.001 across doses.
RadiantLight Ph3 (NCT06505031): Phase 3, placebo-controlled study with 105 participants. The sponsor likewise reported all primary and secondary endpoints met, including cataplexy, with p<0.001 across doses.

The sponsor also reported that more than 95% of completers entered the long-term extension and that no treatment-related serious adverse events were observed in Phase 3.
That is extremely impressive, but it still belongs in the "sponsor-reported until peer-reviewed publication" bucket.

Hepatotoxicity class shadow: Takeda's earlier OX2R agonist TAK-994 was discontinued for liver toxicity (Dauvilliers 2023, PMID 37494485), so even though oveporexton looks cleaner so far, class-level caution is still reasonable.
Dosing: twice daily.
Funding: Takeda. All major trials industry-funded.

Bottom line: This is the strongest pipeline signal in narcolepsy right now. If the Phase 3 publications match the toplines, it could become a major new standard.

ALIXOREXTON (ALKS 2680) - Alkermes

Class: Oral OX2R agonist.
Status: Entering Phase 3.
Very promising, but still mostly press release and conference level in public view.

Vibrance-1 Ph2 NT1: n=92, 6-week RCT. Company-reported data showed significant MWT improvement at all doses, with p<0.0001 at 6 mg and 8 mg and p=0.01 at 4 mg, plus ESS change of -6.4 to -8.7 versus placebo.
Vibrance-2 Ph2 NT2: n=93, 8-week RCT. Company-reported data said MWT and ESS co-primary endpoints were met at 14 mg and 18 mg, with 95% completion.

The interesting part is not just the wakefulness effect. It is that this is the first OX2R agonist to show multi-week randomized efficacy signals in both NT1 and NT2, which matters because NT2 patients are often left out of the most exciting pipeline conversations.
It also has a once-daily dosing advantage over oveporexton, and dosing convenience matters for chronic adherence.

Safety from company reports looked generally clean, with pollakiuria, insomnia, urinary urgency, dizziness, and headache as the main adverse events, and no major liver, kidney, ECG, or ophthalmic signals reported so far.
Funding: Alkermes. Industry-funded.

Bottom line: Strongest challenger to oveporexton. Still needs peer-reviewed publications and cataplexy-specific Phase 3 detail before it can be ranked with more confidence.

ORX750 - Centessa

Class: Oral OX2R agonist.
Status: Phase 2 recruiting / early clinical development.
Interesting signal, tiny sample, very early.

CRYSTAL-1 Ph2a: company-reported crossover data across NT1, NT2, and IH, with n=55 overall. In the NT1 1.5 mg cohort, the cataplexy endpoint came from only 7 patients and showed an 87% relative reduction in weekly cataplexy rate with p=0.0025.
The same report said ESS fell from 19.6 to 5.1 on drug and that half of patients exceeded 30 minutes on MWT, but the MWT number came from only 6 patients.

This is exactly the kind of result that looks amazing and still should not be overinterpreted. An n of 7 is tiny even for Phase 2a, and a point estimate that large can move a lot when more patients are added.
The larger Phase 2 study, NCT06752668, is expected to give a much more reliable answer.

Reported side effects across cohorts were pollakiuria 51%, insomnia 22%, dizziness 13%, and headache 11%, which is a noticeably heavier AE profile than the cleaner orexin programs so far.
Funding: Centessa. Industry-funded.

Bottom line: spectacular headline, microscopic sample. Interesting, but not something I would rank near established treatments or late-stage orexin agonists yet.

ALSO IN THE PIPELINE (Earlier Stage / Less Cataplexy Data)

E2086 (Eisai): early OX2R agonist with active-comparator wakefulness data, but no meaningful cataplexy evidence yet.
Samelisant: H3 inverse agonist in the same broad class as pitolisant, likely useful but unlikely to change the ceiling of the class unless later data are much stronger than expected.
TAK-994: discontinued for hepatotoxicity (PMID 37494485) and still the main reason people are cautious about the OX2R class.
Mazindol ER: I would stay skeptical here because the public evidence package is not nearly clean enough to rank it near the better-supported options.

WHAT THIS MEANS FOR PATIENTS

The practical reality is that cataplexy treatment is split between what is best supported on paper and what is most usable in real life.
Oxybate has the strongest evidence, pitolisant is the cleanest approved non-scheduled option, antidepressants are much more important in real-world care than the literature alone would suggest, and orexin agonists are the future if long-term safety and access hold up.

The honest version:
- Most pivotal trials in this space are industry-funded.
- Total cataplexy trial populations are still small.
- Long-term safety data are thin for the newer agents, especially orexin agonists.
- These drugs will likely be expensive and prior authorization will probably be a pain.
- If you are already stable on current treatment, medications in the pipeline does not automatically mean you need to switch.

PLAIN ENGLISH KEY

Key measurements:
- Weekly cataplexy rate: number of attacks per week.
- Response rate: percent of patients who hit a predefined improvement threshold, often 50% or greater.
- LSMD: the adjusted difference between drug and placebo. Negative means fewer attacks on drug.
- RR: risk ratio. For example, 0.5 means about half the risk.
- MWT: Maintenance of Wakefulness Test.
- ESS: Epworth Sleepiness Scale.

What the terms mean:
- OX2R agonist: a drug that activates orexin receptor 2 and tries to replace part of the missing orexin signal.
- RCT: randomized controlled trial, still the gold standard for proving a drug works.
- p-value: how likely the result is to be random chance, but it does not tell you how big the effect is.
- n: sample size. Small n means less reliable estimates.
- PMID: PubMed ID number.
- NCT number: ClinicalTrials.gov ID number.
- AE: adverse event.
- Serious AE: hospitalization, disability, life-threatening event, or similar major harm.

What "industry-funded" means: the company paid for the trial, which does not make the result fake, but it does mean there is a financial incentive for positive results and selective presentation is a real concern.
Peer-reviewed versus press release: peer-reviewed means outside scientists reviewed it before journal publication, while press release means the company reported it directly without that same level of external scrutiny.

METHODOLOGY

Ranking was based on strength of evidence, sample size, replication, effect size, safety signal, and real-world accessibility.
Critical limitation: there are still no head-to-head cataplexy trials between the main treatments, so cross-trial comparisons and rankings are inherently messy.

reddit.com
u/alemorg — 10 days ago

The most effective wakefulness treatments for narcolepsy, ranked by the evidence

The list below is compiled from a tool that pulls data from various medical research API keys . Medications in trials now are not included. Explanation key at the bottom. Ranked solely by evidence based research.

1: SOLRIAMFETOL (Sunosi)

Class: Dopamine + norepinephrine reuptake inhibitor (DARI). Schedule IV.

Thorpy 2019, Annals of Neurology (IF ~11): n=236, 12-week RCT. MWT +9.8 minutes vs placebo. ESS -5.4 vs placebo.

Largest EDS effect of any approved standalone drug. The 300mg dose appears in some network meta-analyses but is not FDA-approved for narcolepsy, only 75mg and 150mg are.

The evidence quality caveat: this is one trial, not five. No independent replication exists. No head-to-head comparison against modafinil or any other narcolepsy drug. Single-trial effect sizes tend to be inflated relative to pooled estimates, if solriamfetol had the same 5-trial evidence base modafinil has, the observed effect would almost certainly be smaller. But even with a shrinkage adjustment, the MWT improvement likely remains larger than what modafinil or pitolisant produce.

Dosing: once-daily.

Side effects: headache, nausea, decreased appetite, insomnia, anxiety. Blood pressure monitoring recommended.

Funding: Jazz Pharmaceuticals. Single industry-funded trial.

Bottom line: The strongest MWT signal of any single approved pill. Single-trial evidence is inherently less reliable than replicated evidence, but the effect size gap (+9.8 vs modafinil's +3.56 in pooled analysis) is large enough that some of it is almost certainly real.

2: SODIUM OXYBATE + MODAFINIL COMBINATION (Xyrem/Lumryz/Xywav + Provigil/Nuvigil)

Class: GABA-B agonist + wake-promoter. SXB = Schedule III. Modafinil = Schedule IV.

Black 2016, Sleep Medicine: n=222, 8-week RCT. The only combination-therapy Phase 3 trial in narcolepsy. Beat modafinil monotherapy on wakefulness.

Mechanistically, this is the only approach that addresses both sides of the problem: SXB consolidates nighttime sleep (increases slow-wave sleep), which reduces next-day sleep drive. Modafinil provides direct daytime wakefulness. No other approved drug or combination does both.

Dosing: SXB once-nightly (Lumryz) or twice-nightly (Xyrem/Xywav). Modafinil once or twice daily.

Biggest downside: treatment burden. Two controlled substances, a REMS-restricted distribution program for SXB, and SXB cannot be combined with alcohol or other CNS depressants (respiratory depression risk).

Funding: Jazz Pharmaceuticals. Industry-funded.

Bottom line: The strongest overall evidence for addressing the full picture of narcolepsy EDS. Not the strongest raw wakefulness numbers, but the most mechanistically complete approach.

3: MODAFINIL / ARMODAFINIL (Provigil / Nuvigil)

Class: Wake-promoting agent (exact mechanism still unclear). Schedule IV. Generics available. Most prescribed narcolepsy drug worldwide.

Mann 2026 meta-analysis, Sleep Medicine: X: 5 RCTs, n=997. MWT +3.56 minutes vs placebo. ESS -3.34 vs placebo.

Most replicated narcolepsy drug by any standard. Five independent trials pooled across nearly 1,000 patients, an evidence base no other narcolepsy drug approaches. Won both head-to-head trials it was in:

• Beat pitolisant (Dauvilliers 2013, Lancet Neurology, n=95): pitolisant failed the non-inferiority test. Effectively, modafinil proved superior.
• Confirmed non-inferior to amphetamine-dextroamphetamine (Trotti 2024, CNS Drugs, n=NT2/IH patients): at least as effective, with lower abuse liability.

Dosing: once or twice daily. Armodafinil has a longer half-life, single morning dose covers the full day for most people.

Side effects: headache, nausea, anxiety, insomnia. Rare but serious: Stevens-Johnson syndrome (extremely low incidence but well-documented).

Bottom line: Not the biggest effect size, but the deepest evidence base and the best risk/reward/cost profile. If you had to pick one drug based solely on evidence quality rather than raw MWT scores, this wins.

4: PITOLISANT (Wakix)

Class: H3 receptor inverse agonist (increases brain histamine). Unscheduled, no controlled substance restrictions.

Jalal 2026 meta-analysis, Annals of Pharmacotherapy: 6 RCTs pooled, n=1,149. MWT +3.06 minutes. ESS -2.97 vs placebo.

Smallest EDS effect of any approved drug by a meaningful margin. The Dauvilliers 2013 pivotal trial (Lancet Neurology) had n=95 for the pitolisant vs modafinil comparison, and pitolisant failed non-inferiority, modafinil was the better drug. The initial Phase 2 EDS trial that established pitolisant's efficacy signal had only n=32 patients (p=0.024), a sample size a serious biostatistician would consider exploratory at best.

The pooled meta-analysis (n=1,149) gives us the best estimate and confirms the effect is real but small. The real-world value proposition is the unscheduled status. Some patients cannot or will not take controlled substances, and pitolisant is the only approved alternative. It also has some cataplexy effect, which modafinil and solriamfetol lack entirely, but the cataplexy data comes entirely from Eastern European trial sites (Szakacs 2017, Lancet Neurology, n=54 active arm), which raises generalizability questions for US patients.

Side effects: insomnia, headache, nausea, anxiety. QT prolongation is a theoretical risk that hasn't materialized clinically.

Funding: Bioprojet Pharma. All 6 RCTs are industry-funded.

Bottom line: The weakest wakefulness numbers. Its real advantage is being unscheduled and having dual EDS + cataplexy coverage. If you need strong wakefulness, look elsewhere. If you need an option that doesn't touch the controlled substance system, this is it.

5: AMPHETAMINES (Adderall, Vyvanse, Dexedrine)

Class: TAAR1 agonist + monoamine releaser. Schedule II.

Trotti 2024, CNS Drugs: head-to-head vs modafinil in NT2 and idiopathic hypersomnia patients. Confirmed non-inferiority for wakefulness, amphetamines are at least as effective as modafinil in NT2.

The evidence gap: this is the only modern RCT. No large placebo-controlled Phase 3 trial using standard narcolepsy endpoints (MWT, ESS) exists for amphetamines in NT1. For NT1 specifically, the evidence is old and methodologically weak by current standards. Most clinical use is extrapolated from NT2 data and decades of prescribing experience, not from high-quality trials.

Dosing: varies by formulation. IR = 4-6 hours. XR = 8-12 hours. Vyvanse = 12-14 hours.

Side effects: the worst profile of any approved narcolepsy drug. Cardiovascular strain (blood pressure, heart rate), insomnia, anxiety, appetite suppression, tolerance requiring dose escalation, and rebound hypersomnia when the drug wears off. Highest abuse liability of any narcolepsy medication. Long-term cardiovascular outcome data in chronic narcolepsy use is sparse.

Bottom line: Effective, Trotti 2024 proves that. But the evidence is thin for NT1, and the side effect tradeoff is the worst on this list. Most specialists reserve these for patients who have failed modafinil, solriamfetol, and SXB-based regimens.

6: METHYLPHENIDATE (Ritalin, Concerta)

Class: Norepinephrine-dopamine reuptake inhibitor. Schedule II.

No modern RCT exists for narcolepsy, not for NT1, not for NT2. Clinical use is based on older studies from the pre-MWT era and decades of off-label prescribing experience. Effectively a weaker amphetamine with a slightly better side effect profile, but the evidence gap makes it impossible to rank precisely.

Bottom line: The evidence isn't there. It works anecdotally for many people, and decades of real-world use counts for something, but if you're making a purely evidence-based decision, methylphenidate has the weakest case on this list.

The honest version:

• Every Phase 3 narcolepsy trial is industry-funded. Zero are independent. This doesn't make the data fraudulent, but the people paying for the research have a financial stake in the results, and they control what gets published.
• Total unique patients in modern narcolepsy RCTs across approved drugs: approximately 1,500-2,000. For a disease affecting roughly 200,000 Americans.
• Cross-trial comparisons are noisy. Solriamfetol's +9.8 MWT was measured in one trial, one protocol, one population. Modafinil's +3.56 comes from five trials across different populations. Without head-to-head trials between solriamfetol and modafinil, ranking by MWT numbers alone is inherently imprecise.
• The two head-to-head trials we do have (modafinil vs pitolisant, modafinil vs amphetamines) both involved modafinil. That's not a coincidence, modafinil is the benchmark because it works, it's safe, and it's been generic for years.
• Most approved drugs were studied for 7-13 weeks. Narcolepsy is lifelong. Nobody has randomized controlled data on what happens after a year.

PLAIN ENGLISH TRANSLATION

Clinical trial phases explained:

• Phase 1: First time in humans. Small (10-50 people). Tests safety and dosing only. Does NOT tell us whether the drug works.
• Phase 2: Medium-sized (50-300 people). Tests whether the drug works and finds the right dose. Phase 2a is early, sometimes single-dose. Phase 2b is multi-week. A positive Phase 2 is real evidence but not final proof.
• Phase 3: Large (100-3,000+ people). The definitive test. Must beat placebo in a randomized, double-blind trial (neither patient nor doctor knows who got the real drug). Phase 3 success is what gets a drug approved.

Key measurements explained:

• MWT (Maintenance of Wakefulness Test): You sit in a quiet, dark room and try to stay awake. Untreated narcolepsy = typically 2-5 minutes. Normal = >20 minutes. Higher number = better.
• ESS (Epworth Sleepiness Scale): 0-24 questionnaire. "How likely are you to doze off while watching TV / sitting in a meeting / driving?" 0-10 is normal. 16+ is severe. Lower number = better.

What the numbers mean:

• RCT: Randomized Controlled Trial. Patients randomly assigned to drug or placebo. Double-blind. Gold standard.
• Meta-analysis: Pools data from multiple trials. More trustworthy than any single trial. The modafinil MA (5 trials, n=997) is more reliable than the solriamfetol single trial (1 trial, n=236) regardless of which MWT number is bigger.
• p-value: Probability the result is random chance. p<0.05 = less than 5% chance it's noise. p<0.001 = less than 0.1% chance. Does NOT tell you how big the effect is.
• n: Number of patients in the trial. n=32 tells you almost nothing. n=200+ starts to be reliable. n=997 (modafinil MA) is the strongest evidence base in this field.
• Head-to-head trial: Drug A vs Drug B directly. The only way to truly know which is better.
• Non-inferiority trial: A study designed to prove Drug A is "not meaningfully worse" than Drug B. If Drug A fails this test, Drug B was the better drug.
• PMID: PubMed ID number. Paste into pubmed.ncbi.nlm.nih.gov to read the paper.
• NCT number: ClinicalTrials.gov identifier. Look up trial details at clinicaltrials.gov.

What "industry-funded" means:
The drug company pays for the trial. This does not mean the data is fake. It means there is a financial incentive for positive results, and the company controls what gets published. Every modern narcolepsy Phase 3 trial falls in this category. Zero independent replications exist for any approved narcolepsy drug. This is a structural problem in rare disease research, not specific to any one company.

Peer-reviewed vs press release:
Peer-reviewed means independent scientists checked the data before a medical journal published it. Press release means the company announced results themselves with no outside verification.

METHODOLOGY

Data sources: PubMed, Europe PMC, ClinicalTrials.gov, and openFDA (FDA adverse event reporting system). Rankings weight wakefulness effect size (MWT and ESS), number of independent trials, head-to-head evidence, journal tier of key publications, and safety profile. Effect sizes are reported as placebo-adjusted change from baseline unless otherwise noted.

Critical limitation: only two head-to-head trials exist in the entire approved narcolepsy pharmacotherapy literature (Dauvilliers 2013: pitolisant vs modafinil; Trotti 2024: modafinil vs amphetamines in NT2). Cross-trial effect size comparisons are inherently noisy. Any ranking that places one drug above another based on MWT numbers alone is a judgment call, not a scientific conclusion.

Edit: Links to my other research posts

https://www.reddit.com/r/Narcolepsy/s/WaoeBP5xZM

https://www.reddit.com/r/Narcolepsy/s/fRtRSXc3sr

https://www.reddit.com/r/Narcolepsy/s/s5hWOAFPjC

reddit.com
u/alemorg — 11 days ago
▲ 129 r/lego

Complete Lego Ninja series from 1998-99 (Excluding polybags and promotional gifts)

6013 Samurai Swordsman (1998) 
6033 Treasure Transport (1998) 
6045 Ninja Surprise (1998) 
6083 Samurai Stronghold (1998) 
6088 Robber's Retreat (1998) 
6089 Stone Tower Bridge (1998) 
6093 Flying Ninja Fortress (1998) 
3050 Shanghai Surprise (1999) 
3051 Blaze Attack (1999) 
3052 Ninja Fire Fortress (1999) 
3053 Emperor's Stronghold (1999)

Some of the sets are missing a few pieces but I got the complete collection and some duplicate sets for half of them, including two of the biggest sets and I did put them together to make a bigger castle. I also have the boxes for them. I also did get one of the ninja battle packs but that was a poly bag I think. Let me know what you guys think, I’m thinking of creating a huge moc combining all of them.

u/alemorg — 11 days ago

My top 3 favorite brickmania minifigs

I recently posted about helping me identify a lot of brickmania minifigs specifically German soldiers and these are my favorite. Brickmania is definitely expensive but the level of detail is above what Lego does in my opinion.

Also side note they have a fallout brickmania duo, is it worth the high price do you guys think?

u/alemorg — 11 days ago

A review of the most promising clinical trials for narcolepsy right now

To give some context I recently built a tool that connected various medical research APIs together and pulls more data than google scholar or perplexity. I will release more posts about narcolepsy going forward. I hope this gives people more hope especially those who haven’t found a good treatment option. I previously posted some research on L-Carnitine and wanted to add to it by making the post science focused but also an explanation key at the bottom so that anyone can understand it. Let me know what you guys think! It’s ranked from the top most promising.

1: OVEPOREXTON (TAK-861) - Takeda

Class: Oral OX2R agonist (disease-modifying). Status: Phase 3 complete. Regulatory submission planned.

Ph2b (NEJM 2025, PMID 40367374): n=112, 8-week RCT. MWT +12.5 to +25.4 min, ESS -8.9 to -13.8.

FirstLight Ph3 (NCT06470828): n=168, 12-week RCT. All primary and secondary endpoints met, p<0.001.

RadiantLight Ph3 (NCT06505031): n=105, 12-week RCT. All primary and secondary endpoints met, p<0.001.

Two independent Phase 3 trials across 19 countries. Both hit MWT, ESS, weekly cataplexy rate, attention, and quality of life endpoints. Most patients reached normative ranges on wakefulness testing. Over 95% of completers enrolled in long-term extension. No serious treatment-related adverse events.

Hepatotoxicity risk: TAK-994 (Takeda's first OX2R agonist) was discontinued after Phase 2 for liver toxicity (PMID 37494485, NEJM 2023). Oveporexton is structurally different and Phase 3 liver data is clean. But class-level shadow remains.

Dosing: twice-daily (BID).

Funding: Takeda (TSE:4502/NYSE:TAK). Big pharma. All trials industry-funded.

Bottom line: First to the finish line. Strongest evidence package. Two positive pivotal trials plus NEJM publication. If approved, the first disease-modifying narcolepsy drug.

2: ALIXOREXTON (ALKS 2680) - Alkermes

Class: Oral OX2R agonist (disease-modifying). Status: Entering Phase 3.

Vibrance-1 Ph2 NT1 (Alkermes PR Sep 2025, presented World Sleep): n=92, 6-week RCT. MWT statistically significant at all doses (p<0.0001 at 6mg + 8mg, p=0.01 at 4mg). All doses achieved normative wakefulness (>20 min MWT vs 3 min at baseline). ESS -6.4 to -8.7 vs placebo. Also normalized cognition and fatigue.

Vibrance-2 Ph2 NT2 (Alkermes PR Nov 2025): n=93, 8-week RCT. MWT and ESS co-primary endpoints met at 14mg and 18mg. 95% completion rate.

First OX2R agonist with efficacy in both NT1 AND NT2 in multi-week randomized studies. NT2 efficacy matters because these patients have normal orexin levels, suggesting broader applicability.

Once-daily dosing vs oveporexton's twice-daily. Dosing convenience matters for chronic adherence.

Data quality: all results from press releases and conference presentations, not yet peer-reviewed. Phase 3 trials recruiting: NCT07502443 (n=176, NT2) and NCT07540897 (n=150, NT1).

Safety: generally well tolerated. Most common side effects: pollakiuria (frequent urination), insomnia, urinary urgency, dizziness, headache. No signals on liver, kidney, vital signs, ECG, or eye exams. No serious treatment-related side effects.

Funding: Alkermes. All trials industry-funded.

Bottom line: Most versatile OX2R (works in NT1 + NT2), once-daily advantage, clean safety. Strongest challenger. Phase 3 data will determine if it matches or exceeds oveporexton.

3: ORX750 - Centessa

Class: Oral OX2R agonist. Status: Phase 2 recruiting.

  1. Planned Phase 3 (NCT05914194) is n=48, which is tiny for Phase 3 and suggests funding constraints.
  2. Trial has been NOT_YET_RECRUITING for an extended period.

Safety: withdrawn partly due to pulmonary arterial hypertension risk. Phase 2 reported no PAH signals but n=119 total is severely underpowered for rare events.

Funding: NLS Pharmaceutics. CSO authored the drug's primary review paper.

Bottom line: Interesting mechanism, poor evidence, glaring conflict of interest. No way to tell how promising this is without independent data.

Worth Mentioning but didn’t make the cut:

Danavorexton (TAK-925): IV/parenteral only. Impractical for daily chronic use. Takeda is prioritizing oral TAK-861.

TAK-994: Discontinued for hepatotoxicity (PMID 37494485, NEJM 2023). The safety failure that cast a shadow over the entire OX2R class.

THN102: Modafinil + flecainide combination. Phase 2 completed, abandoned.

WHAT THIS MEANS FOR PATIENTS

For the first time, drugs that replace what narcolepsy destroys are in late-stage trials. Oveporexton could be approved as early as 2026-2027. Alixorexton in 2028. These are not better stimulants. Wakix and Sodium Oxybates were better “bandaids” than stimulants, these medications in trials are supposed to be even better than what we have now.

The honest version:

• All data is industry-funded. Zero independent Phase 3 trials.
• Total patients treated with OX2R agonists in published RCTs: under 1,000.
• Long-term safety data does not exist. Nobody knows what 5+ years of chronic orexin receptor stimulation looks like.
• These drugs will be expensive and prior authorization will be difficult.
• NT2 patients: alixorexton is your only pipeline option with Phase 2 data. Same for idiopathic hypersomnia.

Plain English Translation)

Clinical trial phases explained:

• Phase 1: First time in humans. Small (10-50 people). Tests safety and dosing, NOT whether the drug works. If a drug only has Phase 1 data, we know almost nothing about how well it treats narcolepsy.
• Phase 2: Medium-sized (50-300 people). Tests whether the drug actually works and finds the right dose. Phase 2a is early, often single-dose. Phase 2b is later, multi-week. A positive Phase 2 is real evidence but not final proof.
• Phase 3: Large (100-3,000+ people). The definitive test. Must prove the drug works against placebo in a randomized, double-blind trial (neither patient nor doctor knows who got the real drug). Phase 3 success is what gets a drug approved.

Key measurements explained:

• MWT (Maintenance of Wakefulness Test)
• ESS (Epworth Sleepiness Scale)

What the numbers mean:

• OX2R agonist: A drug that activates the orexin receptor 2. Orexin is the brain chemical that keeps you awake. Narcolepsy type 1 destroys the neurons that make orexin. An OX2R agonist replaces that missing signal. This is why these are called "disease-modifying" rather than covering up the symptoms.
• RCT: Randomized Controlled Trial. Patients are randomly assigned to drug or placebo, and neither they nor their doctors know which group they're in (double-blind). This is the gold standard for proving a drug works.
• p-value: The probability the result is random chance. p<0.05 means less than 5% chance it's noise. p<0.001 means less than 0.1% chance. Smaller p-value means stronger evidence. But p-values don't tell you how BIG the effect is. A drug can have p<0.0001 and still be barely better than placebo if the sample is huge.
• n: Number of patients in the trial. Small n means less reliable. n=22 is very low. n=200+ starts to be trustworthy.
• PMID: PubMed ID number.
• NCT number
• AE: Adverse Event. A side effect. "Serious AE" means hospitalization, disability, or life-threatening.
• Non-inferiority trial: A study designed to prove Drug A is "not meaningfully worse" than Drug B. If a new drug fails non-inferiority, it means the old drug beat it. Pitolisant failed this test against modafinil.

What "industry-funded" means:

The drug company pays for the trial. This does not mean the data is fake, but it does mean there is a financial incentive for positive results. Independent (investigator-initiated or NIH-funded) trials eliminate this conflict. Zero Phase 3 narcolepsy trials are independent. Pharma companies can choose not to publish some data since they fund it btw.

Peer-reviewed vs press release:
Peer-reviewed means independent scientists checked the data before a medical journal published it. Press release means the company announced results themselves with no outside verification. Press releases are not worthless, but they are unverified. Assume they are cherry picking the data

METHODOLOGY

Rankings based on: phase of evidence, data quality (peer-reviewed vs press release), effect size, replicability, and safety signal.

Critical limitation: zero head-to-head trials exist between pipeline drugs. Cross-trial comparisons are inherently noisy. Anyone claiming to know which drug is "best" is overstating what the data supports.

Funding: every Phase 2+ narcolepsy trial is industry-funded. Zero investigator-initiated Phase 3 trials exist. This does not invalidate the data but must be mentioned

reddit.com
u/alemorg — 12 days ago

Some highlights from my trip! I love bar harbor!

It’s so beautiful, I felt like maybe for just a moment it was me and the earth and nothing else. Will always remember fondly and will be back. Also I love the blueberry ice cream and popovers

u/alemorg — 16 days ago
▲ 4 r/BMW

Nature makes this bmw look even more beautiful. It was the only rental car available at bar harbor, I didn’t realize that they ran out of rental cars during peak season lol. Regardless I had so much fun!

u/alemorg — 16 days ago

The first time I heard Alex g I think the instrumentals was what got me. Also the raw emotion it conveyed really felt like my emotions turned into music. Tell me about the times when you guys first heard Alex G, what song, and how did you feel?

reddit.com
u/alemorg — 16 days ago

Addison’s disease is caused by insufficient production of cortisol and aldosterone in the adrenal glands. It’s very difficult to diagnose a dog with Addison’s disease because the symptoms are so vague. They describe waxing and waning symptoms like chronic fatigue, vomiting, diarrhea, and weight loss. Addisonian crisis is when they have a severe sudden collapse due to shock, low blood pressure or low blood sugar, that’s what happened to my dog but he’s treated with a monthly injection and daily steroid pill.

I don’t want to scare anyone but spread awareness since it’s so rare and the symptoms seem are common in many diseases. I believe my ER vet said she gets maybe less than 5 a year and a regular vet may only see 1 a year or less. It’s very treatable and their lifespan isn’t affected. Only dilemma is treatment cost and medication which can be quite expensive. But feel to ask questions!

Edit: Mods I am not trying to give medical advice just spread awareness to help others. I am only sharing my experience and what vets have told me.

u/alemorg — 16 days ago